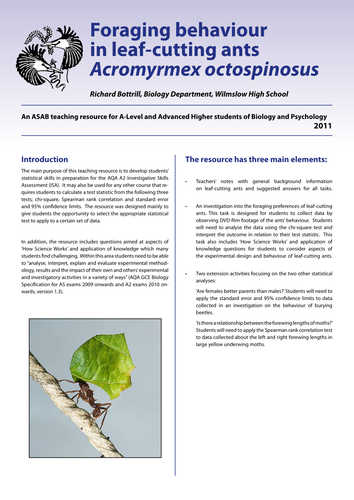

This resource requires students to calculate a test statistic from the following three tests; chi-square, Spearman rank correlation and standard error and 95% confidence limits. Designed to give students the opportunity to select the appropriate statistical test to apply to a certain set of data. Students collect data by observing film footage of the ants’ behaviour then analyse the data using the chi-square test and interpret the outcome in relation to their test statistic. There are notes with information on leaf-cutting ants and suggested answers for all tasks. Written by Richard Bottrill.
Something went wrong, please try again later.
Brilliant resource
Fantastic - just what I needed to get my A2 students engaged with statistics
Fantastic! A good alternative to getting some real leaf cutter ants. Thank you.
Report this resourceto let us know if it violates our terms and conditions.
Our customer service team will review your report and will be in touch.
£0.00
