


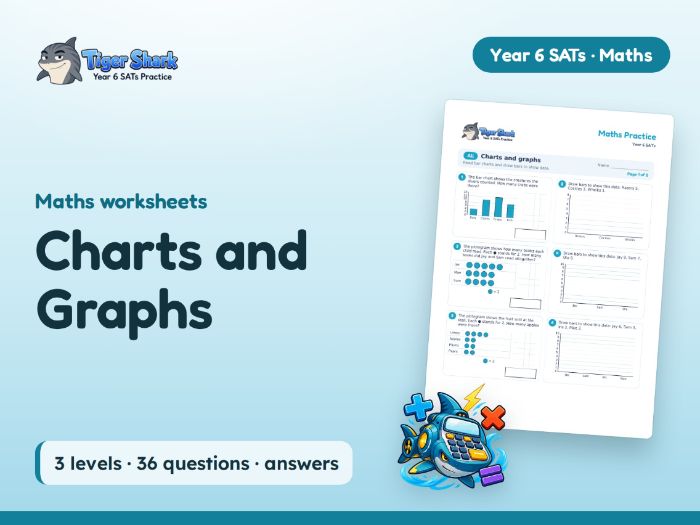
Year 6 maths worksheets on bar charts, pictograms, line graphs and pie charts: 36 questions in three levels (All, Most, Some) with answers. Free PDF.
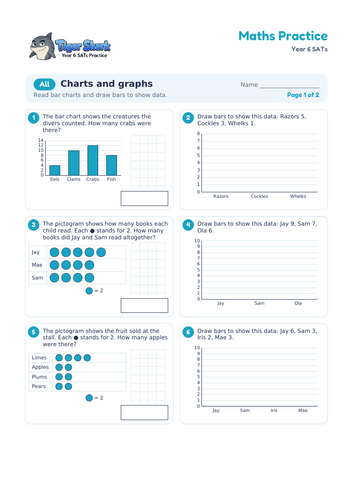
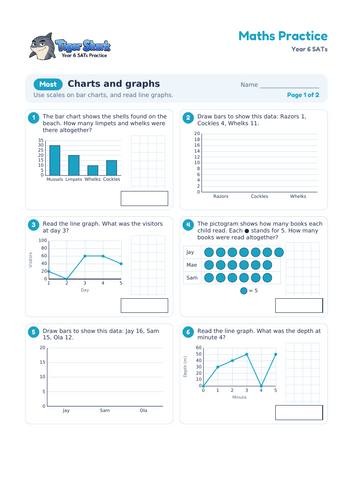
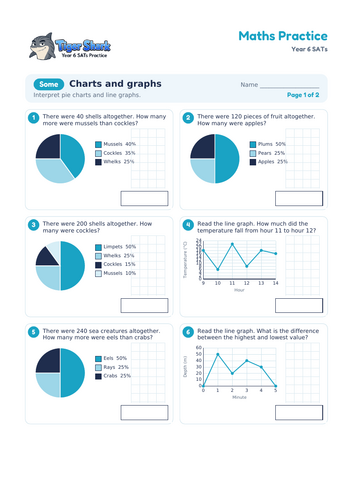
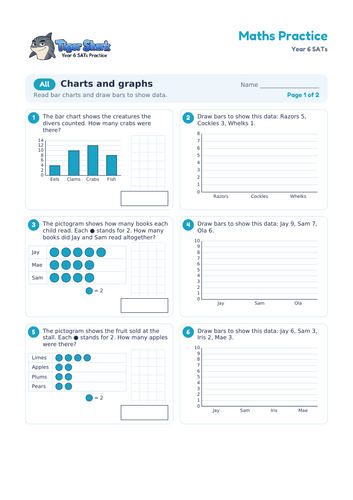
7-page A4 PDF from the Tiger Shark Education question bank. All: Read bar charts and draw bars to show data. Most: Use scales on bar charts, and read line graphs. Some: Interpret pie charts and line graphs. Each level is two pages of six questions, each with its own diagram and space for working, and the last page has every answer, with the correct drawing for each “draw it” question. Each level is also available as its own 3-page PDF. Example questions from the Some level: There were 40 shells altogether. How many more were mussels than cockles? / There were 120 pieces of fruit altogether. How many were apples?
What are charts and graphs in Year 6? Pupils interpret and construct pie charts and line graphs, and use them to solve problems. In a pie chart, each sector represents a fraction of the whole, so the angles add up to 360°. Line graphs show how something changes over time, and children read values between gridlines.
Common mistakes and tips: Common errors with pie charts include treating sectors as amounts rather than fractions of the total. With line graphs, children often misread the scale or read the wrong axis. Encourage pupils to check the scale on each axis first and to use a ruler to read across accurately.
Questions on this topic appear year after year in the KS2 maths SATs. Because each sheet starts with the core skill and builds to test-style problems, it works both for teaching the topic and for spotting gaps during revision.
Teaching ideas: use the All level to check prerequisite knowledge at the start of a lesson, then move children onto Most or Some when they are ready. Squared working space encourages neat written methods. The answer page includes short working for multi-step questions, so pupils can self-mark and see where they went wrong.
Spotting misconceptions: the mistakes children make on this topic are usually consistent, so look for patterns across their answers rather than marking each question in isolation. A short follow-up on the specific misconception, using concrete resources or diagrams, is often more effective than setting more of the same questions.
Use All for children working towards the expected standard, Most for secure Year 5 skills and Some for SATs-standard practice: three entry points to the same lesson. Suits whole-class differentiation, intervention groups, homework and SATs revision, and upper KS2 generally.
Part of a set of 42 Year 6 maths topics.
Something went wrong, please try again later.
This resource hasn't been reviewed yet
To ensure quality for our reviews, only customers who have downloaded this resource can review it
Report this resourceto let us know if it violates our terms and conditions.
Our customer service team will review your report and will be in touch.
£0.00