


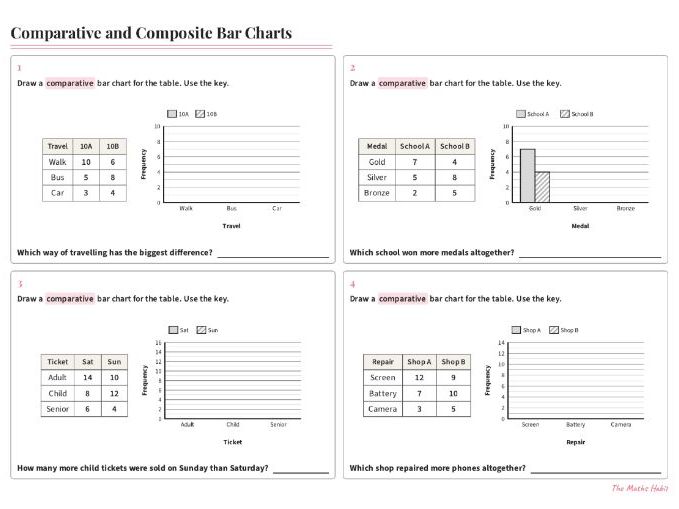
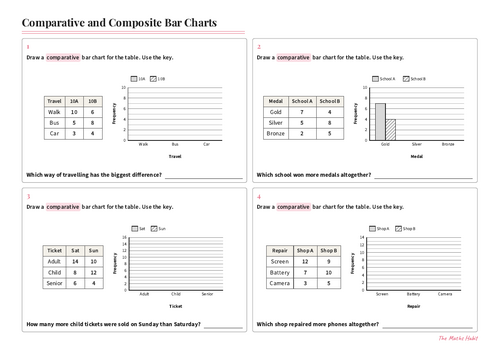
Practise drawing and reading comparative and composite bar charts, then sort data into qualitative, discrete and continuous. 16 questions, full answers included.
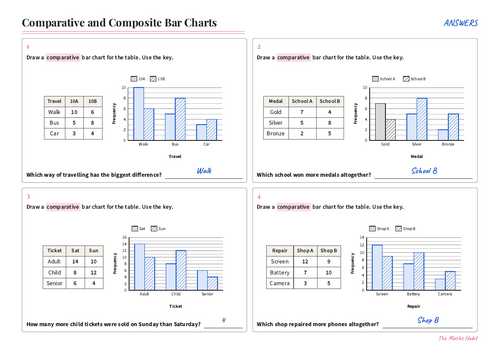
Worksheet (2 pages): students draw comparative bar charts from a table on axes that are already scaled, with the key given, and answer a question about each one. They then draw a composite bar chart, read one back into a table, find a difference from a comparative chart, and finish by sorting six types of data on a classification tree.
Further practice (2 pages): graded by difficulty, in contexts such as screen time, a library, a helpline and a bike hire shop. Questions include choosing a scale and numbering the axis, turning a comparative chart into a composite one, finishing a bar from a given total, working out the money taken from a composite chart, writing fractions in their simplest form, and explaining why a misleading reading is wrong.
Answers to all 16 questions are included as a separate file.
Suitable for GCSE Foundation (AQA S2) and for Key Stage 3 classes working on bar charts.
AI was used to help create this resource, working from my own lesson design.
Something went wrong, please try again later.
This resource hasn't been reviewed yet
To ensure quality for our reviews, only customers who have downloaded this resource can review it
Report this resourceto let us know if it violates our terms and conditions.
Our customer service team will review your report and will be in touch.
£0.00