
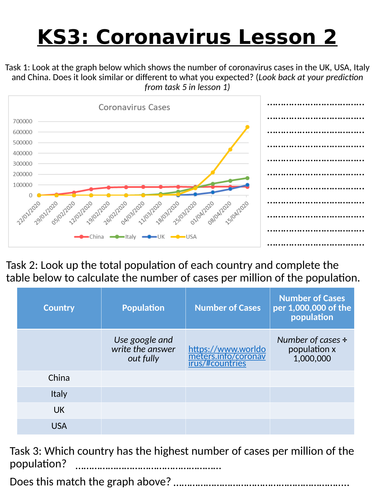
Continues from the first lesson a couple of weeks ago. Asks students to look back at their predictions to see how the virus has increased, calculate the cases per million of the population and then the fatality rate. Students will then think about why the fatality rate varies in different countries and come up with a prediction of how the number of deaths will change over the next few weeks.
There is a KS4 and KS5 version of this lesson also available and I hope to write a third lesson about coronavirus hotspots in the UK over the next couple of weeks.
Something went wrong, please try again later.
Report this resourceto let us know if it violates our terms and conditions.
Our customer service team will review your report and will be in touch.
£0.00