
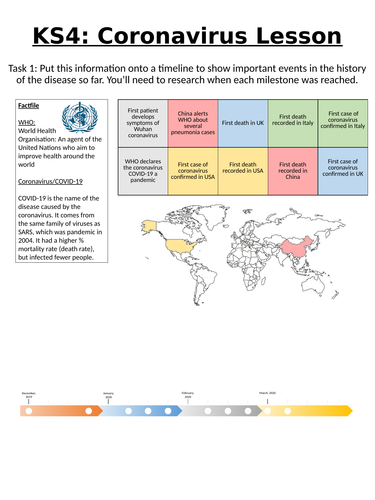
An introduction to epidemiology. Asks students to research and place certain events on a timeline to show how the disease has spread. Then complete a line graph to show the number of cases in these countries. Students will then describe their graphs, create a prediction as to what will happen next and think about how social distancing and population structure will affect their predictions.
There is a KS3 and KS5 version of this lesson also available and I hope to write a follow up lesson over the Easter Holidays.
Something went wrong, please try again later.
This is exactly what I was looking for my statistics class to understand how important facts and predictions are at a time like this. So so grateful for you putting this together.
Report this resourceto let us know if it violates our terms and conditions.
Our customer service team will review your report and will be in touch.
£0.00