


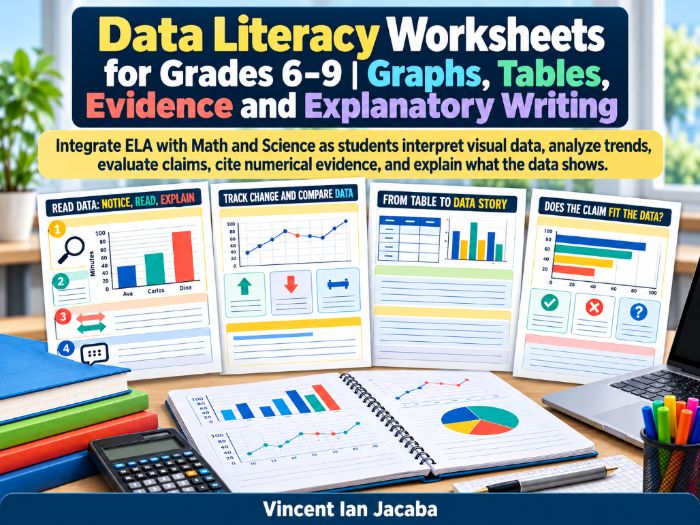
Build students’ data literacy and evidence-based reasoning with this Grades 6–9 resource combining English, maths, and science skills. Students interpret graphs, tables, and scatter plots, analyse trends, evaluate claims, distinguish association from causation, and write clear explanations supported by numerical evidence.
Suitable For
Grades 6–9 / ages approximately 11–15.
Skills Covered
- Reading graphs, tables, and scatter plots
- Comparing values and identifying trends
- Evaluating supported and unsupported claims
- Recognising misleading graph scales
- Distinguishing association from causation
- Selecting numerical evidence
- Writing evidence-based explanations
What’s Included
- Instructional anchor charts
- Scaffolded worksheets
- Data interpretation and claim-evaluation activities
- Explanatory writing tasks
- Data Story Capstone
- Answer keys
Classroom Uses
Ideal for whole-class teaching, independent practice, small groups, intervention, review, assessment, and cross-curricular English, maths, or science lessons.
Help students move beyond simply reading data to interpreting evidence carefully, explaining patterns accurately, and making well-supported conclusions.
Something went wrong, please try again later.
This resource hasn't been reviewed yet
To ensure quality for our reviews, only customers who have purchased this resource can review it
Report this resourceto let us know if it violates our terms and conditions.
Our customer service team will review your report and will be in touch.
£5.50