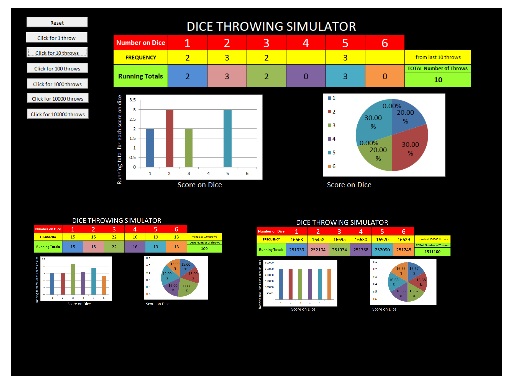

In this EXCEL FILE - Simulate the throwing of 1,10,100,1000,10000 or 100000 dice at a time with the click of a button.
A bar graph and pie chart are updated with each click.
Hopefully a useful tool for demonstrating that experimental probabilities differ from expected probability but as you increase the frequency of the experiment that they get closer to the expected.
the Excel worksheet does use MACROS to make the buttons work and you may be asked to enable them.
Some versions of Excel don’t allow this so it will be a case just trying it (sorry if it doesn’t work for you)
Something went wrong, please try again later.
very nice activity thank you so much
Love this! I will feature it as one of my Resource of the Week selections for May. Thanks for sharing!
Excellent tool for teaching probability. Thanks for sharing.
Report this resourceto let us know if it violates our terms and conditions.
Our customer service team will review your report and will be in touch.
£0.00