


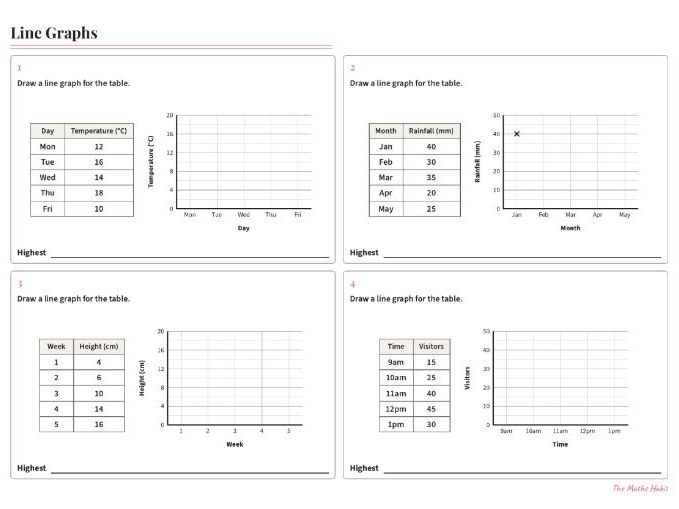
Practise drawing line graphs from a table and reading them back. 16 questions, full answers included.
Worksheet (2 pages): the first four give a table and axes that are already scaled, so students plot the points, join them with straight lines and pick out the highest value. The support then fades: students choose their own scale for two graphs, then complete a table by reading values from a line graph.
Further practice (2 pages): graded by difficulty, in contexts such as a café, a garden thermometer, two museums, rainfall, a climbing club, a choir, a sunflower and a phone shop. Questions include choosing a scale, estimating a value between two readings, drawing two lines on the same axes, using a mean to find a missing value, spotting a fall from the slope, a percentage increase, weeks that are not equally spaced, and explaining why a graph is misleading.
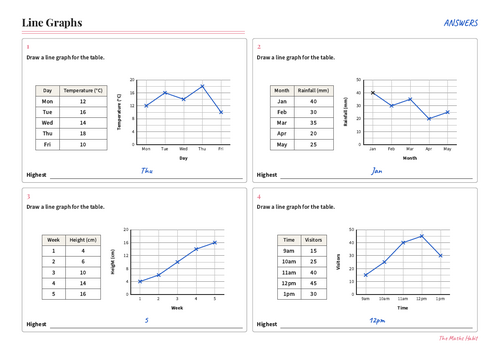
Answers to all 16 questions are included as a separate file.
Suitable for GCSE Foundation and Higher (AQA S2) and for Key Stage 3 classes working on line graphs.
AI was used to help create this resource, working from my own lesson design.
Something went wrong, please try again later.
This resource hasn't been reviewed yet
To ensure quality for our reviews, only customers who have downloaded this resource can review it
Report this resourceto let us know if it violates our terms and conditions.
Our customer service team will review your report and will be in touch.
£0.00