


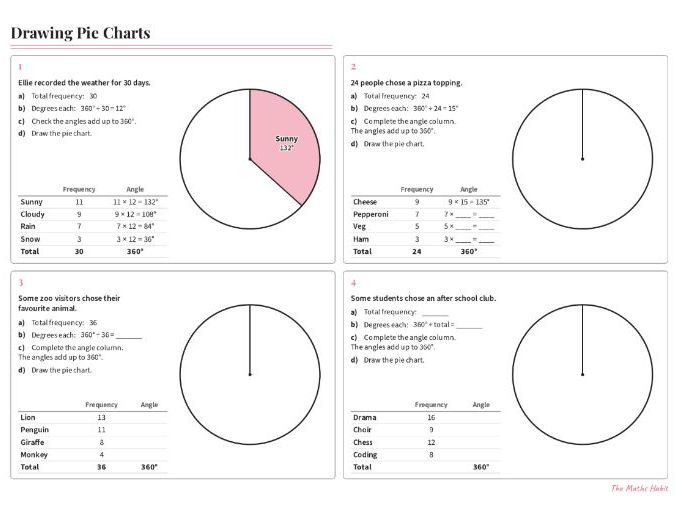
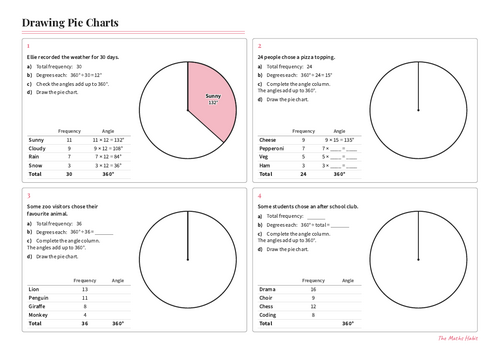
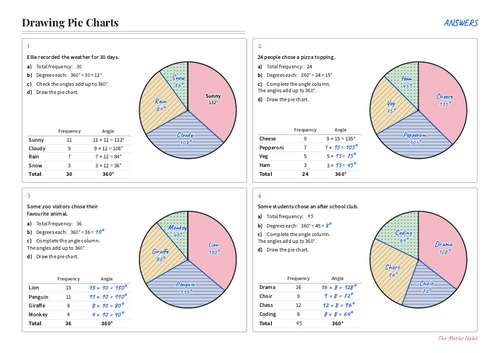
Practise drawing pie charts: work out the degrees for each item, fill in the angle column, then draw. Every sector has its own pattern as well as its own colour, so the charts still read when printed in black and white. 16 questions, full answers included.
Worksheet (2 pages): the first chart is fully worked with the total, the degrees each and every angle shown, then the steps fade as students complete the angle column, find the total themselves, draw their own start line, complete a table from a word problem, and explain why someone’s angle is wrong.
Further practice (2 pages): graded by difficulty. Museum visitors, book club ratings, a bar chart turned into a pie chart, money spent from £72, measuring angles to read back frequencies, working backwards from given angles, percentages turned into a pie chart, and explaining why a bigger sector does not always mean more people.
Answers to all 16 questions are included as a separate file.
Suitable for GCSE Foundation (AQA S2) and for Key Stage 3 classes working on pie charts.
AI was used to help create this resource, working from my own lesson design.
Something went wrong, please try again later.
This resource hasn't been reviewed yet
To ensure quality for our reviews, only customers who have downloaded this resource can review it
Report this resourceto let us know if it violates our terms and conditions.
Our customer service team will review your report and will be in touch.
£0.00