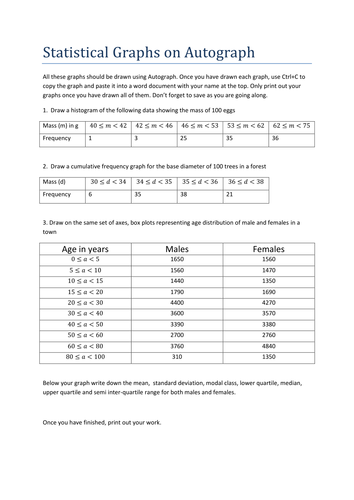

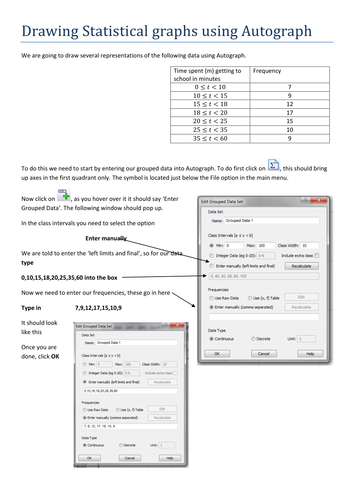
First give out the tutorial sheet which guides students through drawing a histogram, cumulative frequency graph and box plots using Autograph when the data has unequal class intervals.Then give out the Handout and let them have a go at doing it themselves
Something went wrong, please try again later.
This resource hasn't been reviewed yet
To ensure quality for our reviews, only customers who have downloaded this resource can review it
Report this resourceto let us know if it violates our terms and conditions.
Our customer service team will review your report and will be in touch.
$0.00