
KS3 Biology - Ecosystems and Competition - Activate2: 2.9 (+3.1) - AQA Activate 9.1.3 and 9.1.4
Challenge opportunities throughout
Lesson contains starter - keywords for both topics and tasks to check understanding.
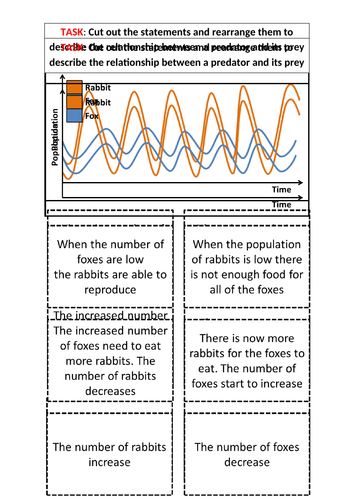
Predator-prey relationship graph with cut and stick activity including copy of graph for students to stick in their books
**2nd Worksheet included for: **
Explaining why predator numbers are lower than prey numbers using recap of food chains and energy transfer - including percentage calculation practice
Data included for Red Squirrel Vs Grey Squirrel on worksheet with further percentage calculation challenge questions and calculating differences task
Answers animate onto screen to allow opportunity of peer/self assess
See the lesson taught here:
https://youtu.be/7UIs1UWIa14
Also convenient for students who miss the lesson
Get this resource as part of a bundle and save up to 25%
A bundle is a package of resources grouped together to teach a particular topic, or a series of lessons, in one place.
Bundle
Activate 2 - Ecosystem Processes - B2 Chapter 2
Activate 2 - Biology 2 - Chapter 2 This contains 9 lessons over 9 presentations and + 5 worksheets covering: 1 - Photosynthesis - leaf adaptations 2 - Photosynthesis - Transpiration 3 - Plant minerals and deficiencies 4 - Chemosynthesis 5 - Aerobic Respiration 6 - Anaerobic Respiration 7 - Food Chains and Food Webs 8 - Disruption to Food Chains and Food Webs 9 - Ecosytsems (+ Competition)
£20.30
Bundle
AQA Activate 9.1 - Interdependence
This contains 3 presentations covering: 9.1.1 Food Chains and Food webs 9.1.2 Disruption to Food Webs 9.1.3 + 9.1.4 Ecosystems and Competition No worksheets are required for any of these lessons - but it is important to read the presenter notes under the slides prior to the lesson as there are many animations (especially in 9.1.2) which require some narration.
£6.75
Something went wrong, please try again later.
Normally, your power points are good value for money. This was a poor effort for £3 charge. Minimal input by you and the advertising on the notes section is distasteful. Won't be purchasing again I am afraid. It is a shame, because normally I feel I get value for money.
Report this resourceto let us know if it violates our terms and conditions.
Our customer service team will review your report and will be in touch.
£3.00