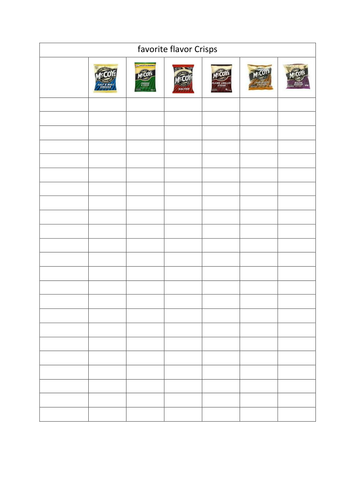

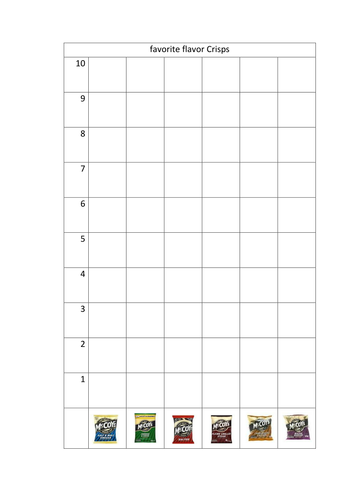
We used the first sheet to collect data on which flavour was each pupil's favourite (After tasting crisps). Then we converted the information into a bar graph using the small pictures of crisps. The final lesson was comparing results and answering questions using the data. A very popular lesson.
Something went wrong, please try again later.
This resource hasn't been reviewed yet
To ensure quality for our reviews, only customers who have downloaded this resource can review it
Report this resourceto let us know if it violates our terms and conditions.
Our customer service team will review your report and will be in touch.
$0.00