
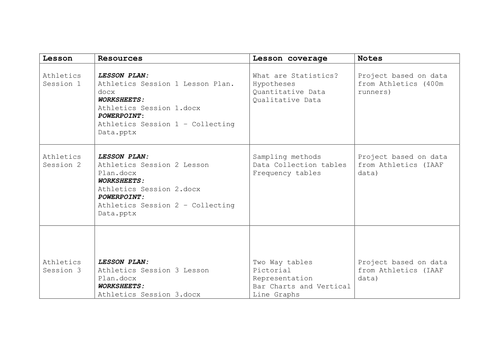
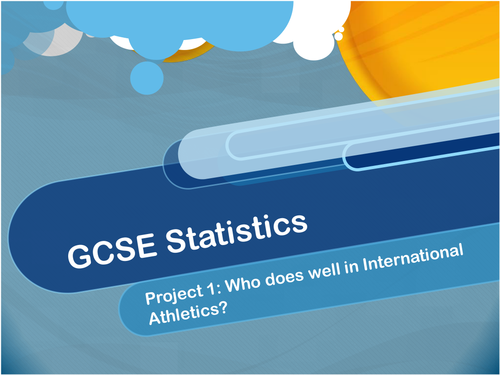
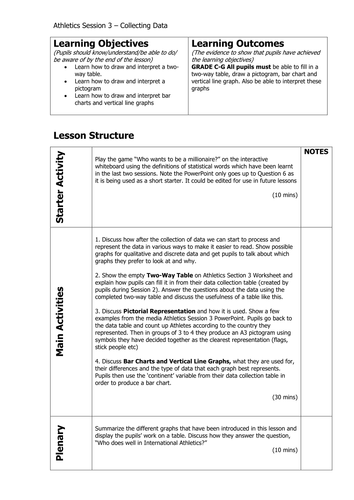
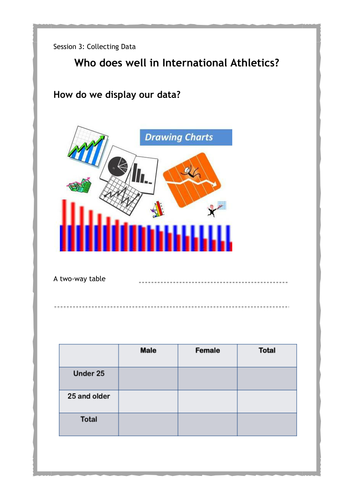

For Year 10 and 11 GCSE Statistics students. Using a real-life project approach this is the third lesson looking at data collection from Athletics statistics. Included is the lesson plan with links to videos, the Powerpoint presentation for the lesson and worksheets for students. There is also an overview of the full 5 lesson project. This lesson looks at drawing and interpreting two-way tables, pictograms, bar and vertical line graphs. Can be used as a one-off lesson.
Something went wrong, please try again later.
A lot of work has gone into this. I like that it uses real data, and the millionaire game will provide a good recap of key terms. Thanks for sharing.
Excellent saved me so much time and makes statistics more enjoyable. Anymore like this would be welcome especially if aimed at higher level graphs. Thank you so much
Report this resourceto let us know if it violates our terms and conditions.
Our customer service team will review your report and will be in touch.
£0.00