
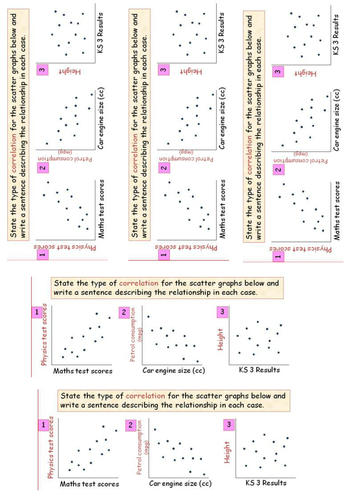
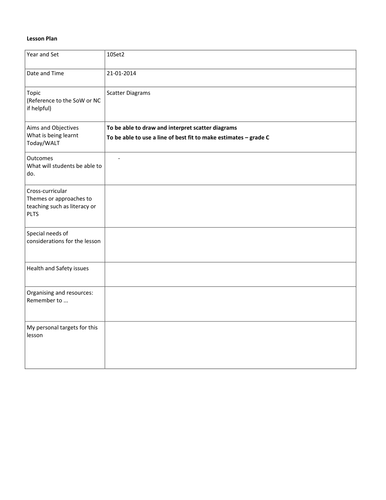
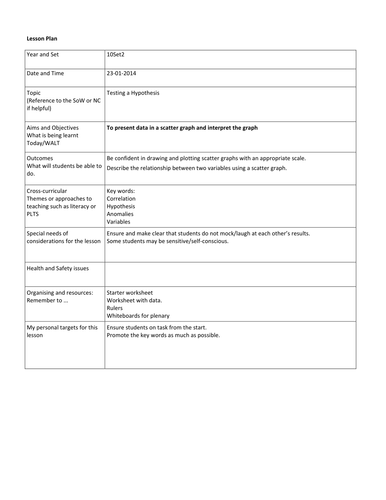


Lesson Plans, starter and presentations for 2 lessons worth, if some textbook exercises are used alongside. Plenary provided for both lessons - True/False and key words.
I always use the Hans Rosling video (link in smartboard) to engage the students.
At end of lesson 1, I get students to measure each other's head lengths and widths, and this data is what forms the main of Lesson 2.
Use the student data to draw scatter graphs. (my smartboard gives some random student data, and my own measurements - students find it funny to see me as an anomaly in the scattergraph and we discuss why this is.) Discuss broken axes , line of best fit and anomalies.
I then give them the excel produced graph (slide 4), and then a 'perfect' line of best fit (slide 5) which shows where they should be if they are to be considered 'mathematically beautiful' as given by the Golden Ratio! (Notice my position now!!).
Next few slides give some stimulus to discuss golden ratio and its uses in the artistic/natural world.
Something went wrong, please try again later.
This resource hasn't been reviewed yet
To ensure quality for our reviews, only customers who have downloaded this resource can review it
Report this resourceto let us know if it violates our terms and conditions.
Our customer service team will review your report and will be in touch.
£0.00