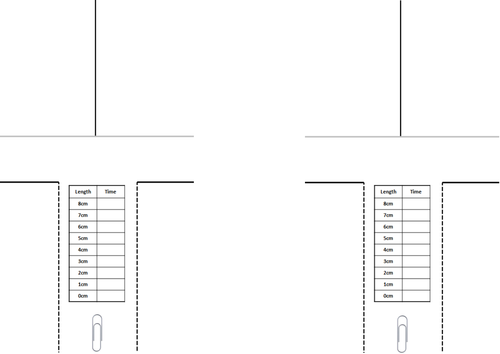
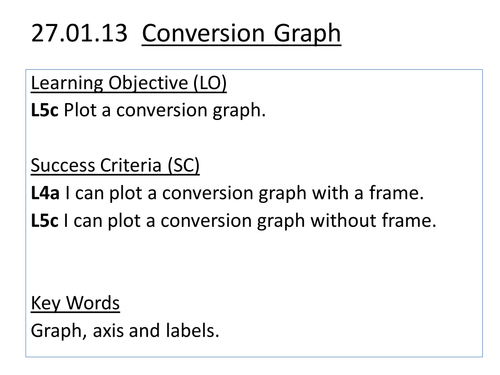

A fun approach to collecting data using simple paper helicopters and cutting propellors to different lengths. Students are introduced to accurate measurement and there are options for pooling class results and investigating reliability. Then progress to graphing data using scatter graphs and possibly constructing a coversion graph relating the two variables. Ideal for the L5+ student and the disengaged mathematician or scientist!
As always the activities are an outline for you to enrich. Please leave comments and feedback to further improve this resource.
Something went wrong, please try again later.
This resource hasn't been reviewed yet
To ensure quality for our reviews, only customers who have downloaded this resource can review it
Report this resourceto let us know if it violates our terms and conditions.
Our customer service team will review your report and will be in touch.
£0.00