


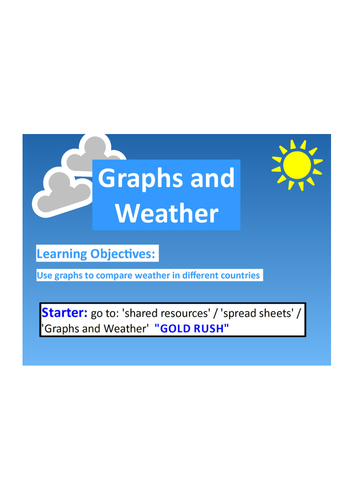


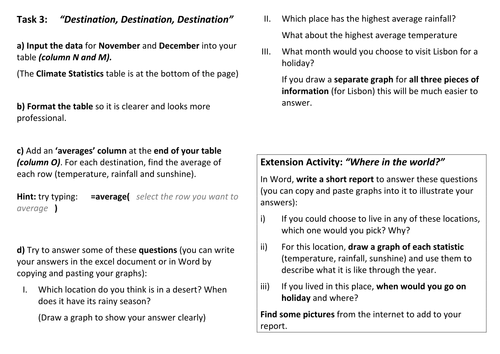

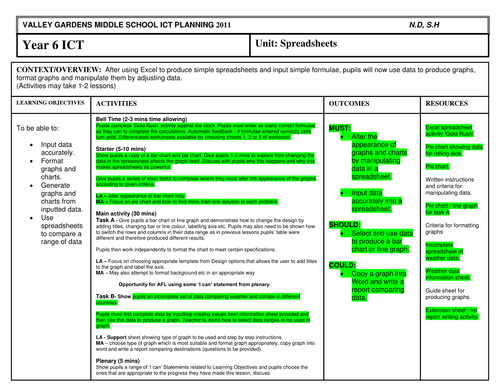
Introduction to manipulating bar charts and pie charts in Microsoft Excel. Includes problem solving tasks with self-assessment 'I can' statements at each step of the lesson. Final activity can be extended to a written task (you could get pupils to produce a holiday brochure etc.) The starter is an activity from a fine TES resource contributor (can&'t remember his name - search for &';GOLD RUSH' as he has many more like this).
Something went wrong, please try again later.
Super cross curricular resource for Computing and manipulating data in Maths as well as Geography.
Excellent. Had several very productive lessons using this resource.
This resource was great for my year 8 class. We worked through it exactly as per the lesson plan. It totally catered for multiple levels. Excellent resource for getting students familiar with the capabilities of excel and comfortable in exploring a range of its functions.
I love this resource! I used it in my own way, we did the starter activities first, I then asked the pupils to make a new tab and use the following (https://www.tes.com/teaching-resource/graph-plotting-in-excel-6292390) step by step guide on how to create a pie chart for the rest of the lesson. This was a year 8 class, so I'm sure a more able or higher class would be able to look at the other climate resources too.
Report this resourceto let us know if it violates our terms and conditions.
Our customer service team will review your report and will be in touch.
£0.00