
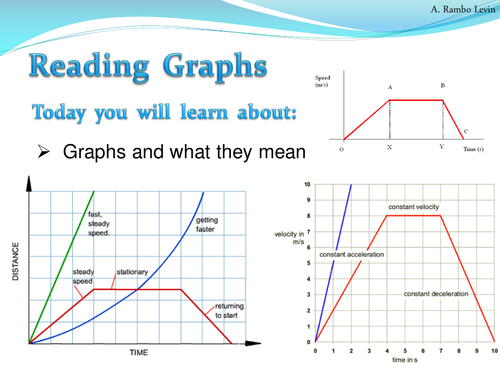
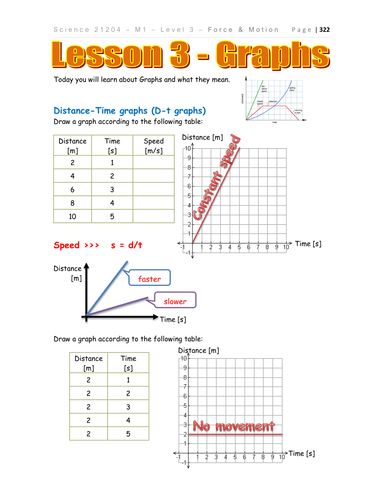
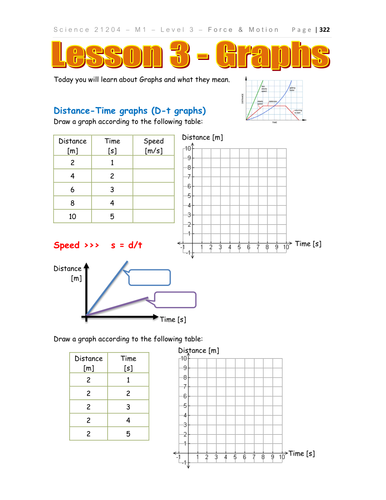
This lesson is about reading graphs. Distance-time graphs and speed-time graphs. Analyzing and understanding the data graphs show us. Calculating area from speed-time graphs to find distance.
A part of a science course for grade 7 (Physics - force and motion). The files contain the theories, lecture and practices, as well as links to videos and online simulations.
The set includes Power-Point presentation and iBook, which is an Interactive Book, where the students fill the blanks that goes in accordance with the PPT slides.
In addition there are all the answers to the iBook for the teacher.
Something went wrong, please try again later.
This resource hasn't been reviewed yet
To ensure quality for our reviews, only customers who have purchased this resource can review it
Report this resourceto let us know if it violates our terms and conditions.
Our customer service team will review your report and will be in touch.
£8.00