
This fully-resourced lesson guides students through the use of the Hardy-Weinberg equations to determine the frequency of alleles and genotypes in a population. Both the detailed PowerPoint and differentiated practice questions on a worksheet have been designed to cover point 6.1.2 (f) of the OCR A-level Biology specification which states that students should be able to demonstrate and apply their knowledge and understanding of the use of the principle to calculate allele frequencies in populations.
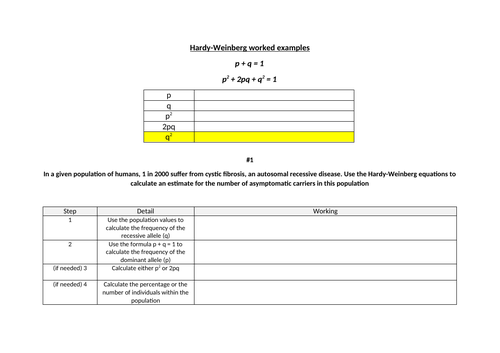
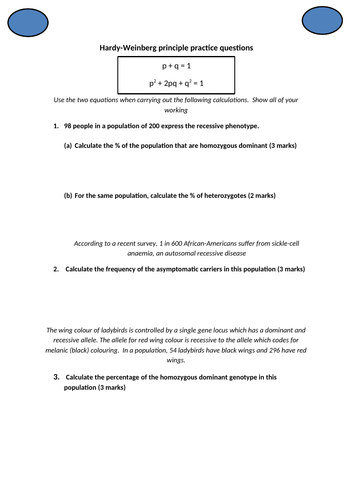
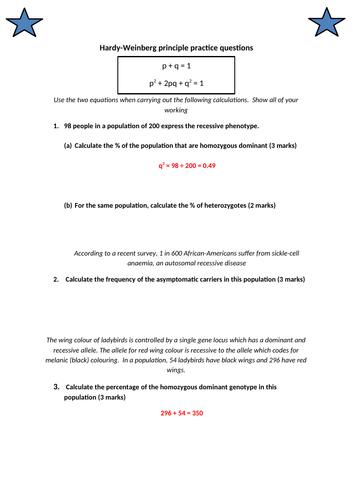
The lesson begins by looking at the two equations and ensuring that students understand the meaning of each of the terms. The recessive condition, cystic fibrosis, is used as an example so that students can start to apply their knowledge and assess whether they understand which genotypes go with which term. Moving forwards, a step-by-step guide is used to show students how to answer a question. Tips are given during the guide so that common misconceptions and mistakes are addressed immediately. The rest of the lesson gives students the opportunity to apply their knowledge to a set of 3 questions, which have been differentiated so that all abilities are able to access the work and be challenged.
Get this resource as part of a bundle and save up to 46%
A bundle is a package of resources grouped together to teach a particular topic, or a series of lessons, in one place.
Bundle
Maths in A-level Biology (OCR A-level Biology)
The mathematical element of the OCR A-level Biology A specification is substantial and every year, there are a large number of exam questions that require the application of a range of mathematical skills. Therefore, a clear understanding of how and when to apply these skills is closely related to success on this course and the following calculations are covered by the 9 lessons that are included in this bundle: * Using the chi-squared test to determine significance between the observed and expected results of a genetic cross * Using the Hardy Weinberg principle to calculate the frequency of an allele or a genotype in a population * Calculating the standard deviation to measure the spread of data * Using the Student's t-test to compare the means of two sets of data * Calculating the temperature coefficient * Calculating the proportion of polymorphic gene loci * Using and interpreting Simpson's index of diversity to calculate the biodiversity of a habitat * Using the Spearman's rank correlation coefficient to consider the relationship of the data * The use and manipulation of the magnification formula A revision lesson is also included in this bundle which acts as a fun and engaging revision of the range of calculations
£10.00
Bundle
Module 6.1.2: Patterns of inheritance (OCR A-Level Biology A)
Each of the 13 lessons included in this bundle are fully-resourced and have been designed to cover the content as detailed in module 6.1.2 (Patterns of inheritance) of the OCR A-Level Biology A specification. The specification points that are covered within these lessons include: * The contribution of environmental and genetic factors to phenotypic variation * How sexual reproduction can lead to genetic variation within a species * Genetic diagrams to show patterns of inheritance * The use of phenotypic ratios to identify autosomal and sex linkage and epistasis * Using the chi-squared test * The factors that can affect the evolution of a species * The use of the Hardy-Weinberg principle to calculate allele frequencies * The role of isolating mechanisms in the evolution of a new species The lessons have been written to include a wide range of activities and numerous understanding and prior knowledge checks so students can assess their progress against the current topic as well as be challenged to make links to other topics within this module and earlier modules.
£14.00
Something went wrong, please try again later.
Top notch! really well thought out powerpoint that breaks down the relevant equations and good practice examples.
A well thought out resource that helps those students that find maths difficult. The worked examples are excellent as they model how the principle is applied which is great especially with students having to work from home sometimes. Very useful resource.
Brilliant resources for teachers and students who find statistics tricky
Clearly explained - like the worked example
Report this resourceto let us know if it violates our terms and conditions.
Our customer service team will review your report and will be in touch.
£0.00