
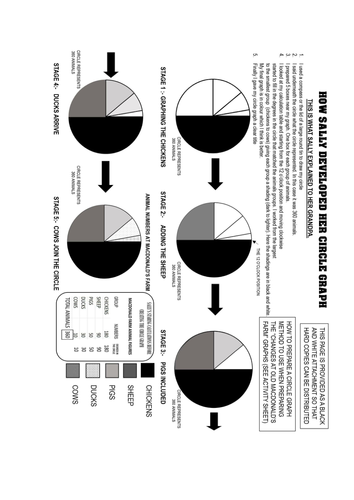
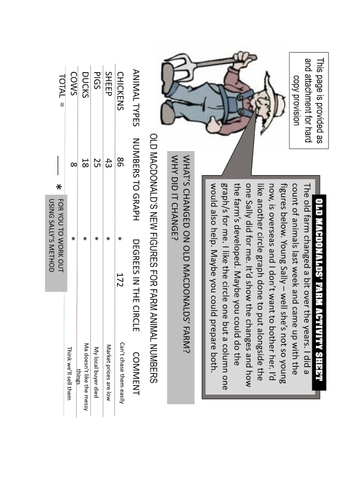
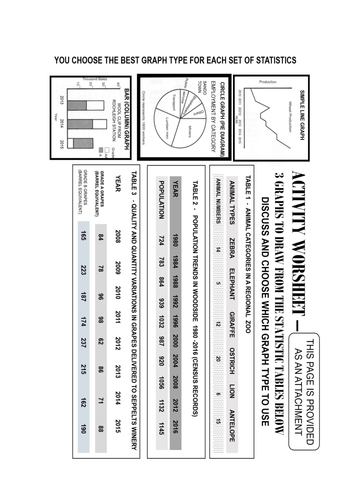
Graphs are an important skill to assist in the understanding of a great range of situations in the study of geography. Old MacDonald's grand-daughter helped her grandfather by producing two graphs to display on his wall. She went further and explained how the circle graph was prepared in a step-by-step process. This is a "how to do it" approach in graphing. The situation of need is provided. The statistics are given and the process of production can be followed. Three attachments are provided so that students can have black and white copies. Attachment 3 provides 3 types of graphs and 3 sets of statistics to use. Choosing the correct graph type will make the drawing of each graph simpler. Singing the song is optional. Your class may collect their own set of figures to graph. Colour, as Sally found out, does result in more effective graphs to interpret. This is a maths/geography cross -curriculum activity aimed at upper-primary to mid-secondary levels. The techniques acquired here will have use in further studies. There's even a chance to help Old MacDonald as his farm changes.
Something went wrong, please try again later.
Some lovely ideas to provoke discussion on representation of data. Thanks for sharing.
Report this resourceto let us know if it violates our terms and conditions.
Our customer service team will review your report and will be in touch.
£0.00