

IGCSE Physics: Distance-Time Graphs | Edexcel Modular | Unit 1 | L3
This lesson covers spec point 1.3 — plotting and explaining distance–time graphs.
PowerPoint includes:
• Retrieval starter reviewing the speed equation and scalar/vector distinction
• Direct Instruction (I Do) — distance–time graph features explained with annotated examples; gradient = speed; horizontal line = stationary; steeper gradient = greater speed; how to calculate speed from gradient
• Guided Practice (We Do) — describe the motion shown in a three-section DT graph; calculate speed from a given gradient; identify the fastest section and justify using gradient comparison
• Independent Practice (You Do) — multi-section DT graph interpretation; sketch a DT graph from a written description of a journey; calculate average speed from graph data
• Review and Reflect — 3 MCQs and exit ticket graph description
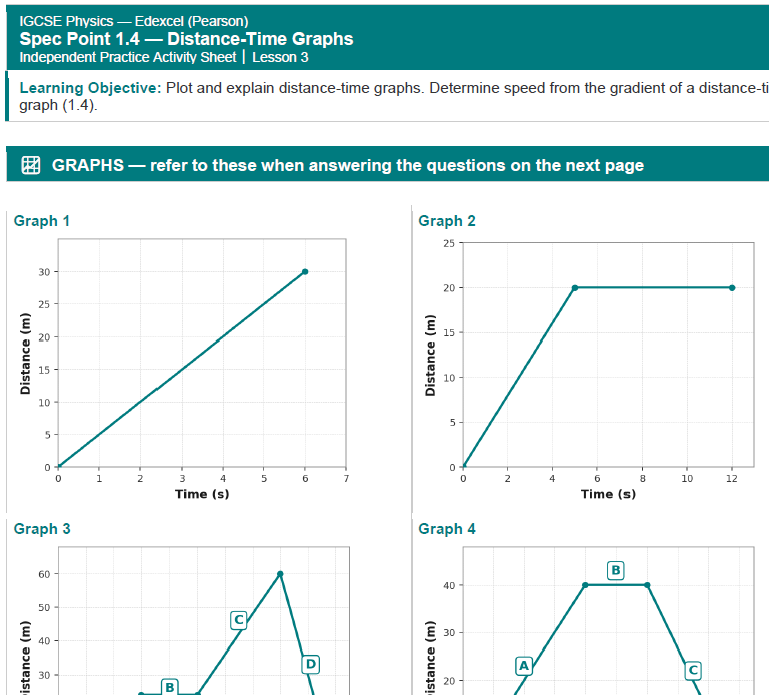
Activity Sheet includes:
• Labelled distance–time graph for interpretation questions
• 10 exam-style questions covering graph description, gradient calculation, motion identification and graph sketching
• Stretch question requiring students to compare two journeys on the same axes and explain the differences
• Full mark scheme for teacher use
Something went wrong, please try again later.
This resource hasn't been reviewed yet
To ensure quality for our reviews, only customers who have purchased this resource can review it
Report this resourceto let us know if it violates our terms and conditions.
Our customer service team will review your report and will be in touch.
£1.99