

IGCSE Physics: Velocity-Time Graphs | Edexcel Modular | Unit 1 | L6
This lesson covers spec points 1.7, 1.8 and 1.9 — plotting and explaining velocity–time graphs, determining acceleration from the gradient, and calculating distance from the area under the graph.
PowerPoint includes:
• Retrieval starter reviewing acceleration calculations and DT graph interpretation
• Direct Instruction (I Do) — VT graph features explained with annotated examples; gradient = acceleration; area under graph = distance travelled; positive gradient, negative gradient and horizontal line identified and explained; area calculations for triangles, rectangles and trapeziums
• Guided Practice (We Do) — calculate acceleration from a VT graph gradient; calculate distance for a constant-velocity section; calculate total distance for a multi-section journey
• Independent Practice (You Do) — multi-section VT graph analysis; gradient and area calculations; sketch a VT graph from a written description of motion
• Misconception check: VT graph vs DT graph — common student confusion addressed
• Review and Reflect — Exit ticket graph analysis
Activity Sheet includes:
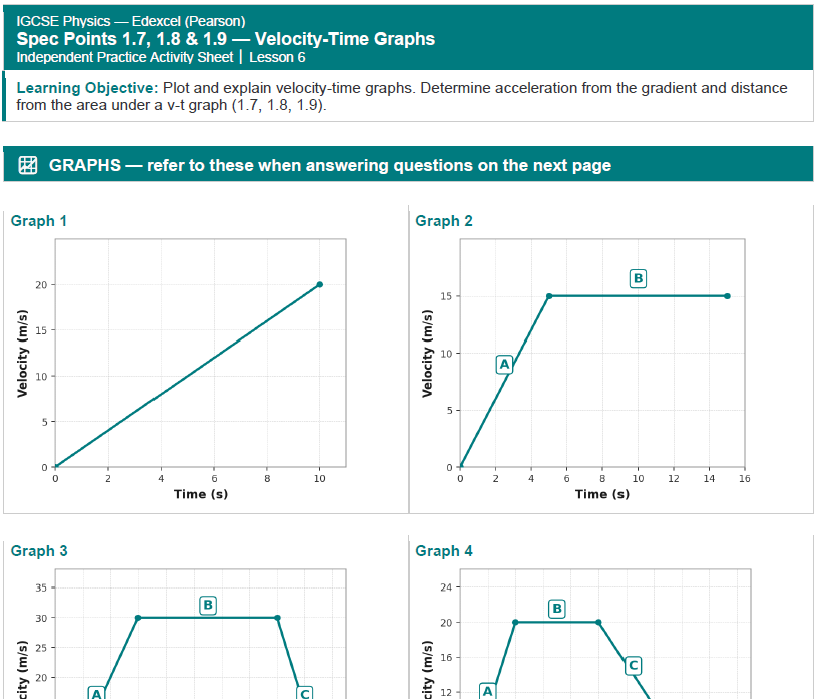
• Formula box: a = Δv / t; distance = area under graph
• Annotated multi-section VT graph for reference
• 10 exam-style questions covering gradient, area (triangle, rectangle, trapezium), graph description and sketching
• Stretch question requiring full analysis of a complex multi-section VT graph including acceleration, deceleration and total distance
• Full mark scheme for teacher use
Something went wrong, please try again later.
This resource hasn't been reviewed yet
To ensure quality for our reviews, only customers who have purchased this resource can review it
Report this resourceto let us know if it violates our terms and conditions.
Our customer service team will review your report and will be in touch.
£1.99