
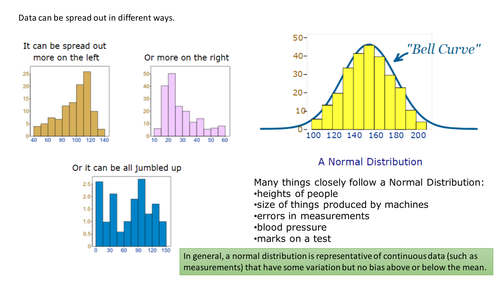
This is a PowerPoint presentation that can be used to introduce normal distributions. The lesson covers what a normal distribution is and then talks through how to convert to a standardised normal distribution (find the z-score). The idea is to encourage the students to understand exactly what they are finding, rather than just using a formula and reading from a table. This means that they will be able to interpret questions and adapt to new situations more easily.
The presentation discusses what we mean by standard deviation and how it applies to a normal distribution. We then look at how we can find the z-score and how this helps us find the probability. We then look at a couple of examples, where we use a table to find the probability from the z-score and vice-versa. I use a 'tail end' table of z-scores but the lesson can easily be adapted to other forms of tables.
I spent quite a lot of time putting the presentation together to use with my Engineering apprentices so hopefully someones else can also find it useful. I must also give credit to www.mathsisfun.com (https://www.mathsisfun.com/data/standard-normal-distribution.html) where I found a lot of the images used in the presentation.
Something went wrong, please try again later.
Thank you for sharing, great resources.
A most useful and valuable resource. Many thanks for sharing
Great resource - thanks for sharing!
Great help!
Very useful resource! Many thanks
Report this resourceto let us know if it violates our terms and conditions.
Our customer service team will review your report and will be in touch.
£0.00