
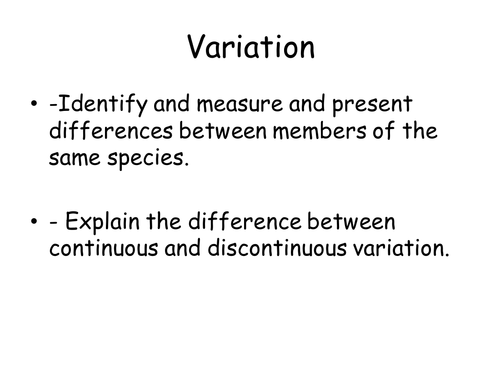
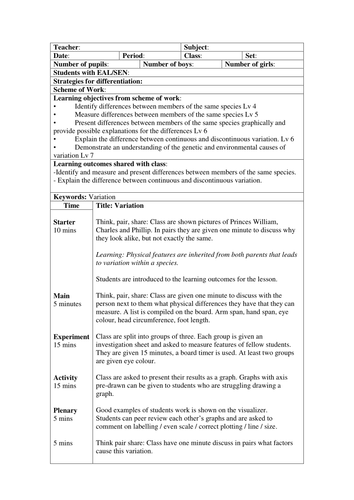
This is a lesson on variation.
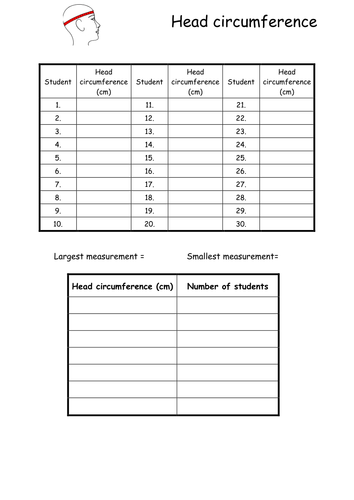
It involves an activity where the class are split into groups, each one getting a feature of their classmates to measure. They then produce a graph of the their results. The graphs can be compared and types of continuous and discontinuous variation discussed.
Resources needed: Tape measures, meter rulers and graph paper. Several printouts of the experiment sheet will also be needed.
Something went wrong, please try again later.
Great resource! Thanks for sharing.
This is really great - thanks
Report this resourceto let us know if it violates our terms and conditions.
Our customer service team will review your report and will be in touch.
£0.00