docx, 12.21 KB
docx, 12.21 KB
PDF, 14.39 KB
PDF, 14.39 KB
PDF, 32.62 KB
PDF, 32.62 KB
ppt, 562.5 KB
ppt, 562.5 KB
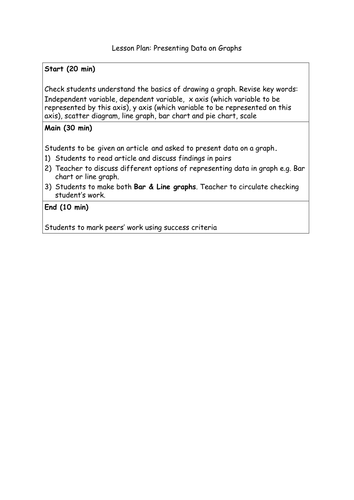
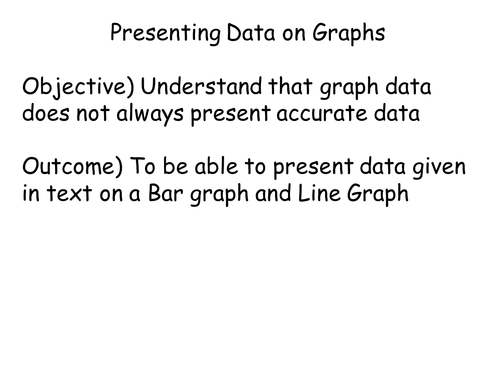
Continuation from Lesson 01. Students to use their own tables and plot a bar graph,curve graph & a line of best fits. 
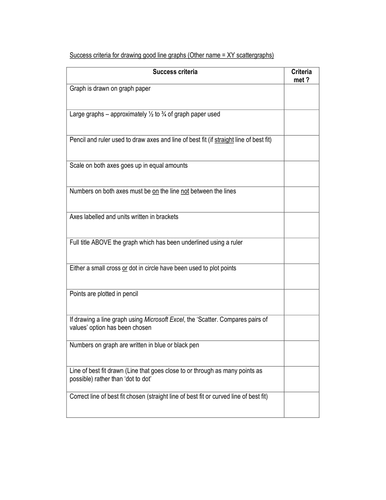
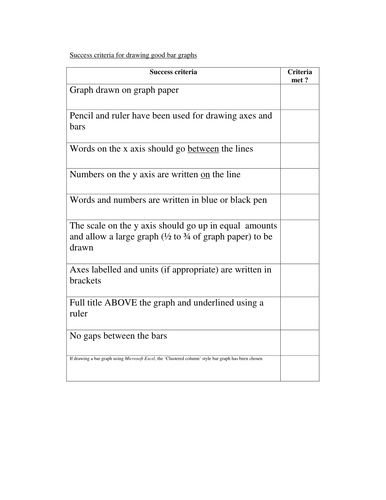
Pupils peer mark each others' work.
Creative Commons "Sharealike"

Reviews

5

Something went wrong, please try again later.

ora

5 years ago
5

Mishmush78

6 years ago
5

feefee1978

7 years ago
5

Great resource. Thank you for sharing it.

slikaus

10 years ago
5

Great resource.

rachfenwick

10 years ago
5

Excellent. Great self assesment tool.

Report this resourceto let us know if it violates our terms and conditions.
Our customer service team will review your report and will be in touch.