Line graphs
Subject: Mathematics
Age range: 10 - 11
Resource type: Lesson (complete)


Something went wrong, please try again later.
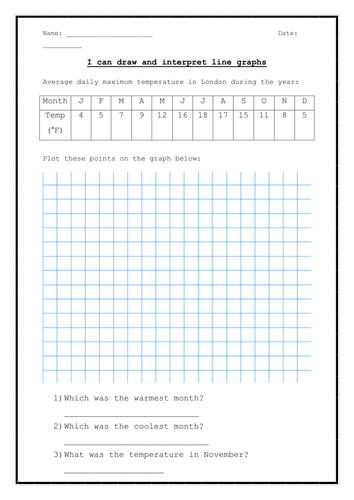
With a little modification (remove the temperatures and the city name) this makes a good science activity for recording and graphing average temperatures of cities in different parts of the world.
Report this resourceto let us know if it violates our terms and conditions.
Our customer service team will review your report and will be in touch.