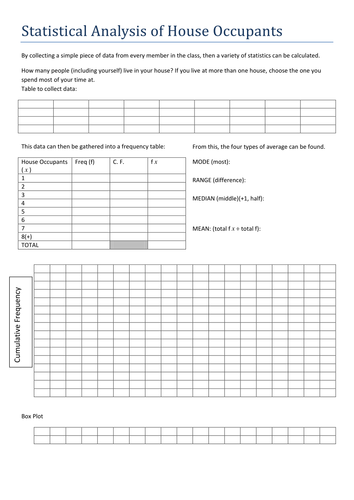


Collect, represent and interpret data collected from the class, on discrete and continuous data.
The word.doc is handed to members of the class, with the excel.doc displayed on the screen after the ppt.doc has been discussed.
The aim is for the class to interpret the 4 averages from the tables, along with plotting and interpreting Cumulative Frequency curves and box plots.
I have attached a copy of the data collected from my class to show how the excel.doc works.
Something went wrong, please try again later.
Report this resourceto let us know if it violates our terms and conditions.
Our customer service team will review your report and will be in touch.
£0.00