
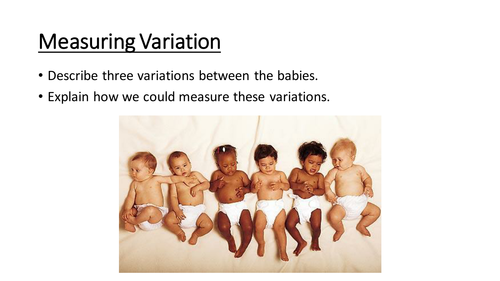
This is a full lesson in which students investigate how to measure the two types of variation. It teaches them to distinguish between continuous and discontinuous variation before collecting data and presenting it as a graph.
It includes:
- Bell work
- Differentiated objectives
- Examples and task to identify continuous and discontinuous data.
- Resources to measure variation in class.
- Example data to use for graph drawing.
- Hints and tips for graph drawing.
- Peer assessment guide.
Something went wrong, please try again later.
Some errors in the slides.
Report this resourceto let us know if it violates our terms and conditions.
Our customer service team will review your report and will be in touch.
£1.00