


Resource for delivering multiple/comparative bar charts to KS3/KS4 students. Powerpoints used to deliver the topic. Worksheets to give practise. There are 2 paths for delivery-one for when a scale is given to use and the other for the student to decide on a suitable scale. Part of a Unit in delivering graphical representation of data in the Edexcel GCSE Statistics course, chapter 2 of the textbook that goes with the course.
Something went wrong, please try again later.
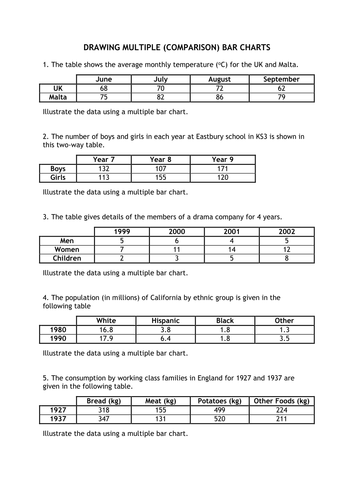
Useful resource. I did not know the UK had an average monthly temperature of 68 degree Celsius in June!
Great presentation & questions
Useful Resource
Fantastic resources .Thank you for sharing.
Report this resourceto let us know if it violates our terms and conditions.
Our customer service team will review your report and will be in touch.
£0.00