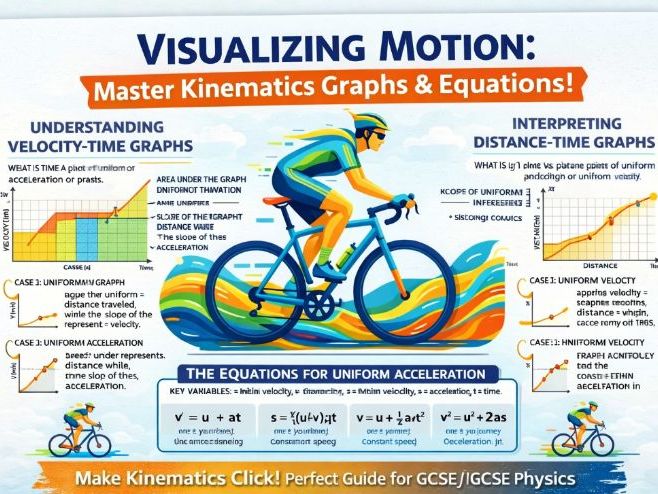

A colourful, student-friendly infographic that helps learners visualise motion using real-world cycling context. It clearly explains velocity–time graphs, distance–time graphs, and the four SUVAT equations, with labelled graphs, key variable definitions, and a worked example of a cyclist’s journey to tie everything together. Ideal as a revision poster, lesson summary, or classroom display for GCSE/IGCSE physics on kinematics and uniform acceleration
Something went wrong, please try again later.
This resource hasn't been reviewed yet
To ensure quality for our reviews, only customers who have purchased this resource can review it
Report this resourceto let us know if it violates our terms and conditions.
Our customer service team will review your report and will be in touch.
£2.99