
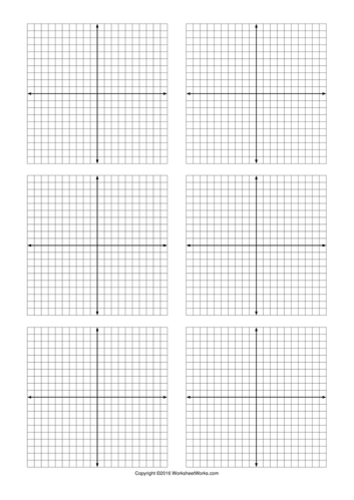
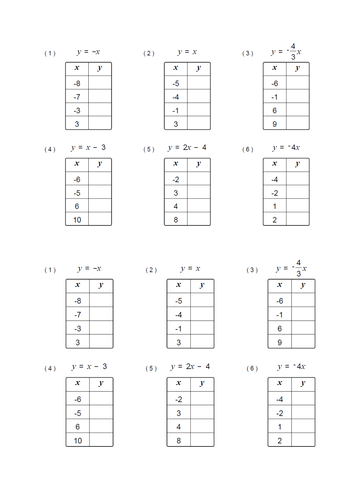

A slow walk through of how to plot a linear graph, starting with filling in a function table, then onto plotting. The blank axes also allows for a chance to look at correct scales.
Something went wrong, please try again later.
Thanks for sharing.
Report this resourceto let us know if it violates our terms and conditions.
Our customer service team will review your report and will be in touch.
£0.00