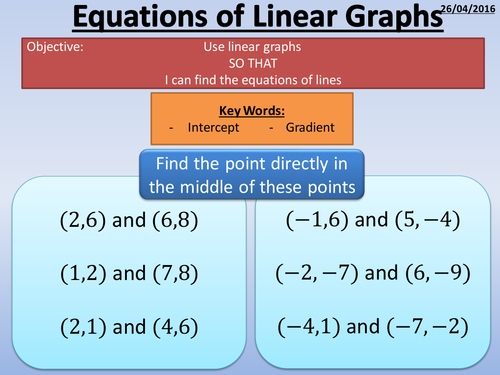

This lesson discusses how to plot a linear graph using the 'y=mx+c', and has a group matching task where students must match the equations to the correct graphs, while higher ability students can fill in the missing equations or plot the missing graphs to show they have mastered the topic.
Something went wrong, please try again later.
Thanks for the graph and equations task - Fantastic for helping cement learning.
Thanks for sharing, very nice.
Report this resourceto let us know if it violates our terms and conditions.
Our customer service team will review your report and will be in touch.
£0.00
