
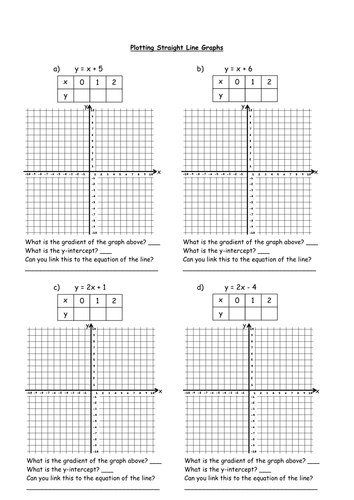
In this lesson, student learn how to plot straight line graphs by using a table of values. There is a sheet of questions that they can get straight into without having to draw out axes. In addition, there is a good question about investigating what happens if you switch the x and y values in an equation, which should lead to some nice discussions and discoveries! If you liked this resource then please check out my other stuff on TES! (updated 5/2/17)
https://www.tes.com/teaching-resources/shop/Owen134866
https://www.tes.com/teaching-resources/shop/Owen134866
Something went wrong, please try again later.
excellent resource
Perfect for my online pupils. Thank you!
Great
Excellent. Good selection of graphs plus a good investigation at the end. Perfect - just what I needed. Thanks
Report this resourceto let us know if it violates our terms and conditions.
Our customer service team will review your report and will be in touch.
£0.00