


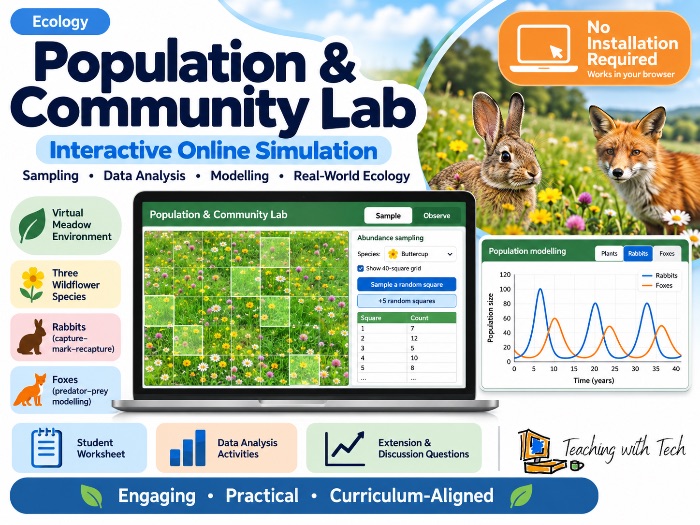
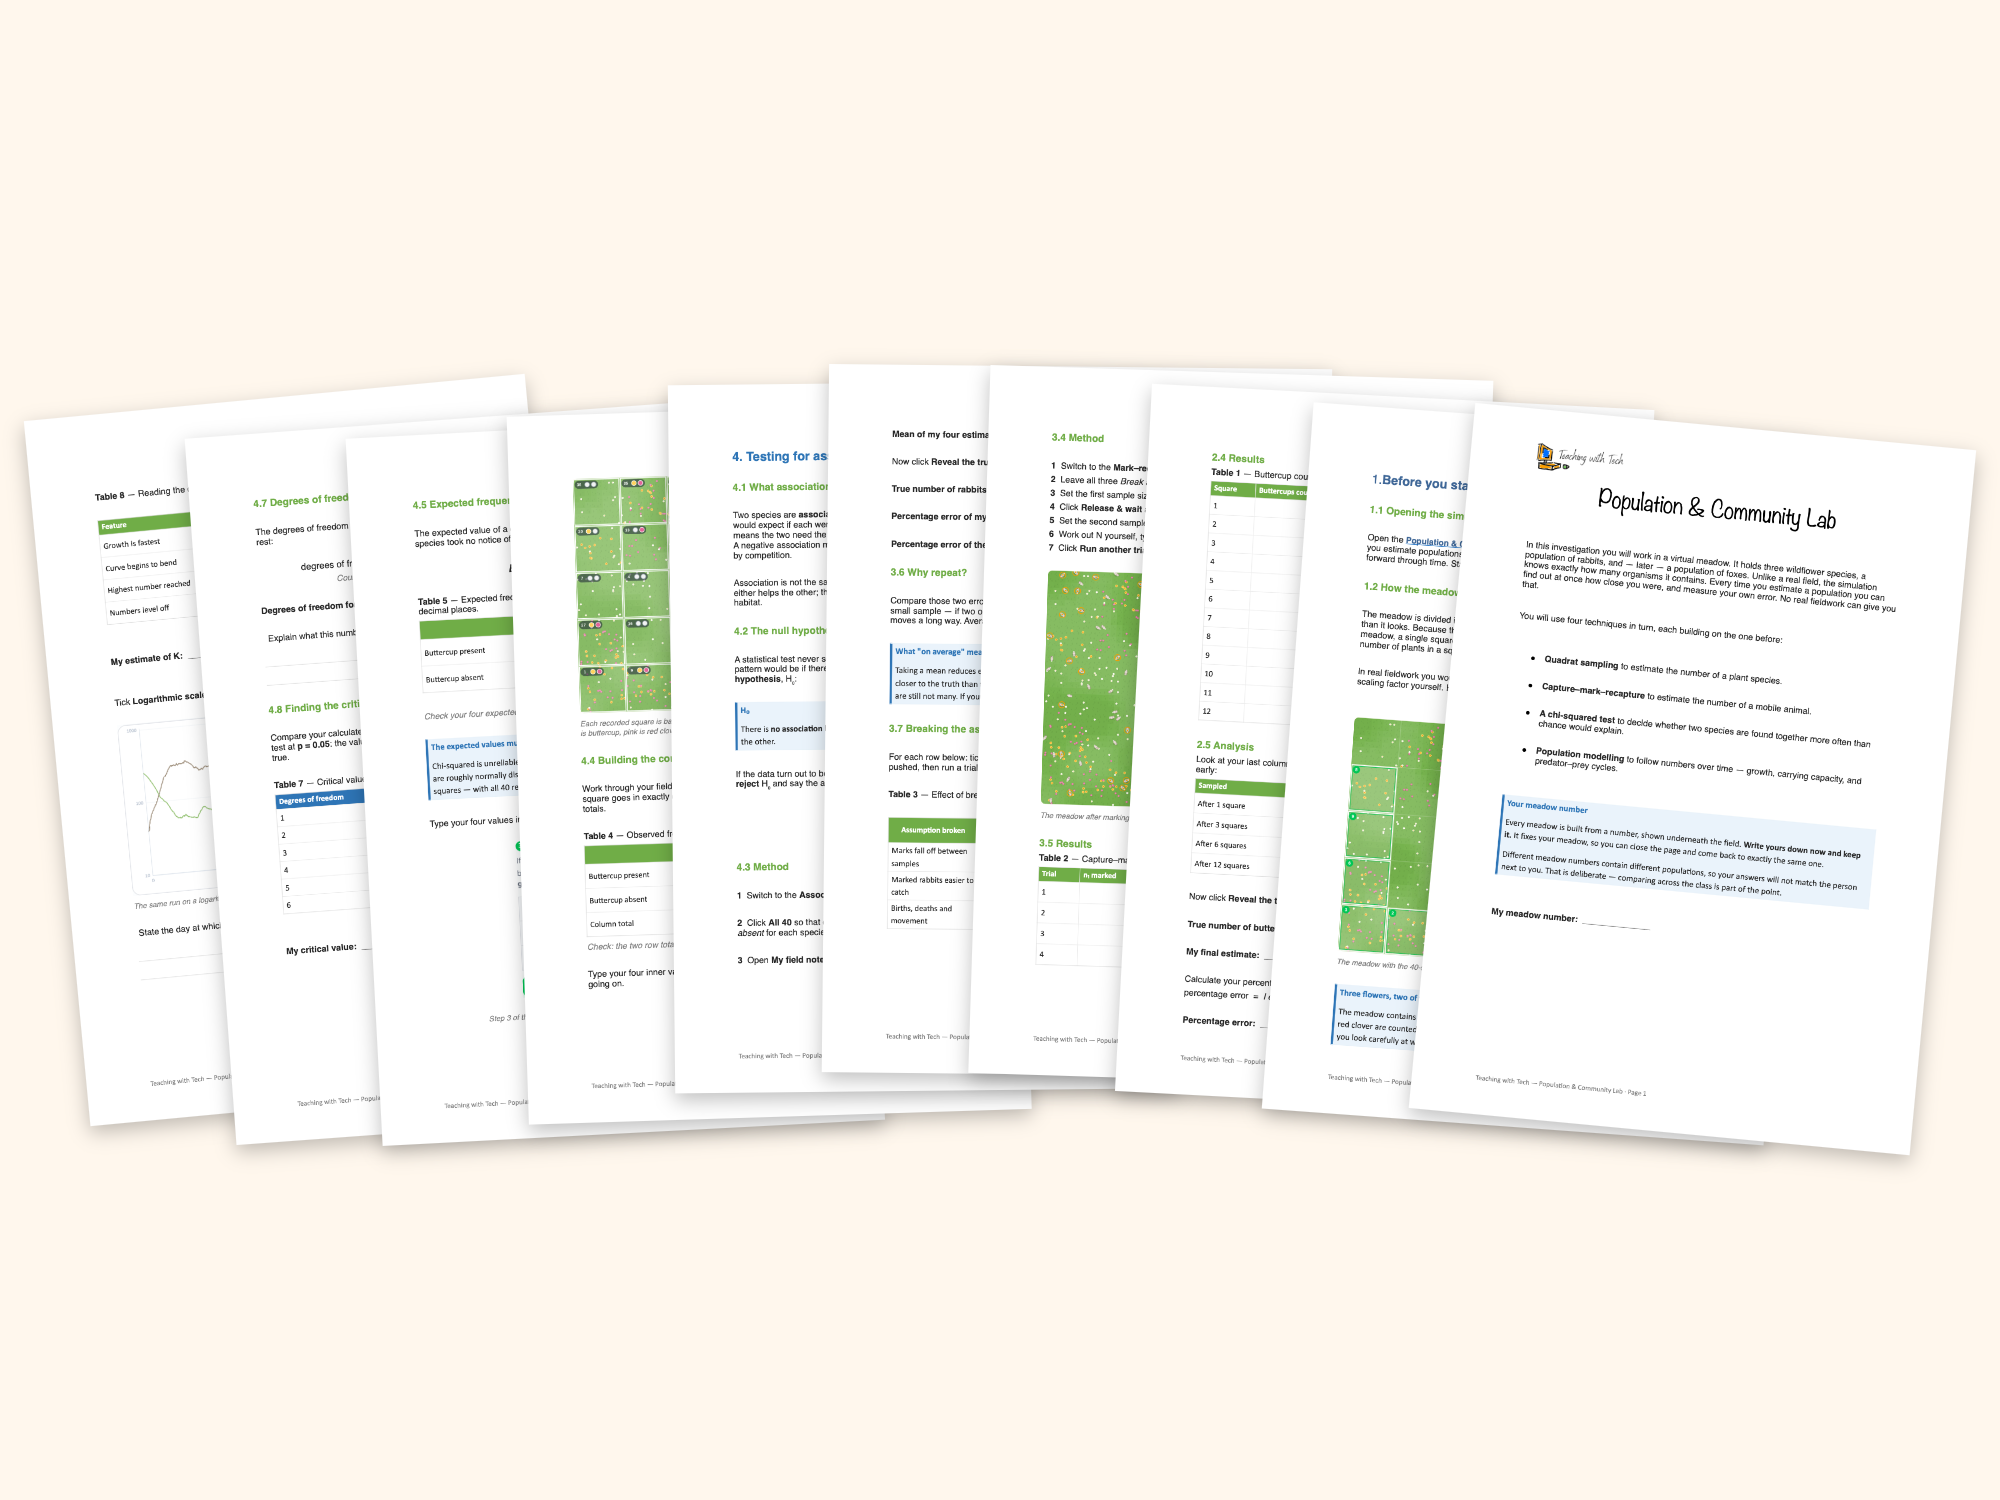
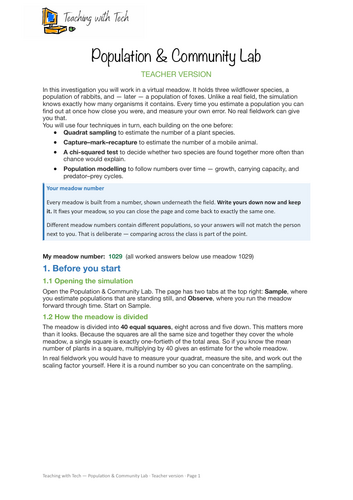
A complete four-part investigation into population sampling and population dynamics, built around a free browser simulation of a virtual meadow. No fieldwork, no weather, no Petri dishes — and no waiting three weeks for a growth curve.
Because the simulation knows exactly how many organisms it contains, students find out immediately how close their estimate came. That single feature turns “sampling error” from a sentence they memorise into a number they measured themselves.
WHAT STUDENTS DO
-
Quadrat sampling The meadow is divided into 40 equal squares, so the scaling factor is exactly ×40 and the arithmetic stays out of the way. Students sample squares one at a time, watch the estimate swing wildly and then settle, and finally reveal the true number of buttercups. A built-in task has them deliberately cherry-pick the richest-looking squares, so they see the difference between random error and bias for themselves.
-
Capture–mark–recapture Catch, mark, release, mix, recatch. Students read n1, n2 and m from the simulation and calculate the Lincoln index themselves — the tool checks the answer but never supplies it. Three assumptions can be deliberately broken (marks fall off, marked animals become trap-happy.
CURRICULUM FIT
IB Diploma Biology — C4.1 Populations and communities (first assessment 2025 and 2028). Also touches B4.2 ecological niches and the Tools and Inquiry skills.
AP Biology — Unit 8 Ecology; chi-square appears on the AP formula sheet, and this gives students somewhere to practise it with data they generated.
A-Level Biology — ecology, sampling techniques and statistical tests across all major boards.
NGSS — HS-LS2-1, HS-LS2-2, HS-LS2-6.
GCSE / IGCSE — quadrat sampling and capture–recapture sections work well on their own.
Runs in any modern browser on a laptop, desktop, Chromebook or tablet. Nothing to install, no student accounts, no logins, no data collected — which means it works on locked-down school networks and satisfies most district privacy requirements without a review.
Every tool exports csv, so students can take their own data into Sheets or Excel for graphing and further analysis.
Something went wrong, please try again later.
This resource hasn't been reviewed yet
To ensure quality for our reviews, only customers who have purchased this resource can review it
Report this resourceto let us know if it violates our terms and conditions.
Our customer service team will review your report and will be in touch.
£5.00