
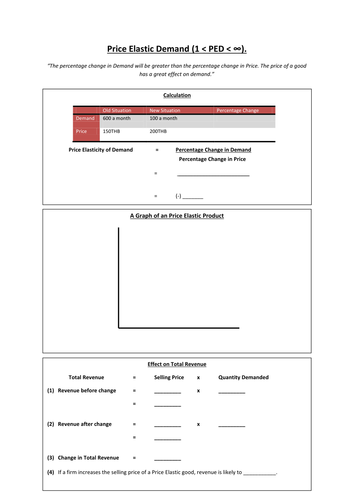

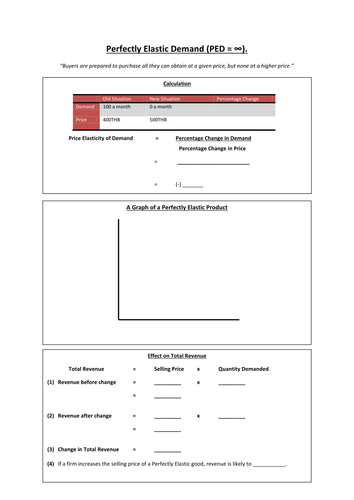
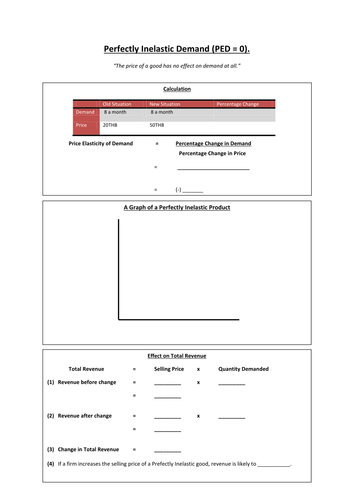
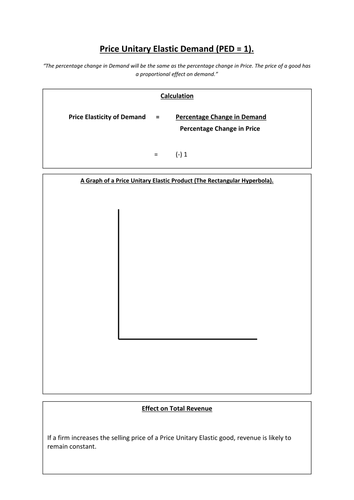

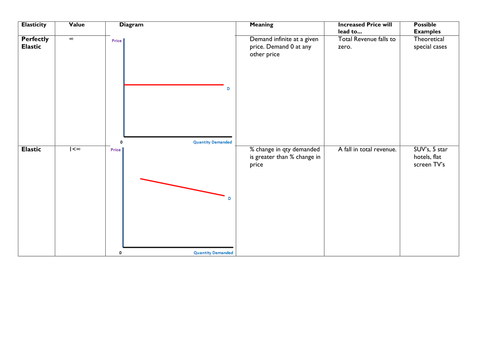
PowerPoint Showing the demand curves with different elasticities, and the effect a change in price has on revenue.
I teach PED before Supply, so no supply curves shown.
Students fill in the sheets as the PPT develops.
If you find it useful, or can have any suggestion on how to improve, please leave a comment.
Ali.
Something went wrong, please try again later.
Great resources. Any answer sheets for the activities?
brilliant - thank you!
I started teaching recently. I find this resource very useful. Mainly because, i know the concept but i dont know how to present it to the student. This material showed me the way. Thanks a ton for sharing it
I really find this helpful.... but I'd like you to be more clear on where the answer are for the worksheets.
Report this resourceto let us know if it violates our terms and conditions.
Our customer service team will review your report and will be in touch.
£0.00