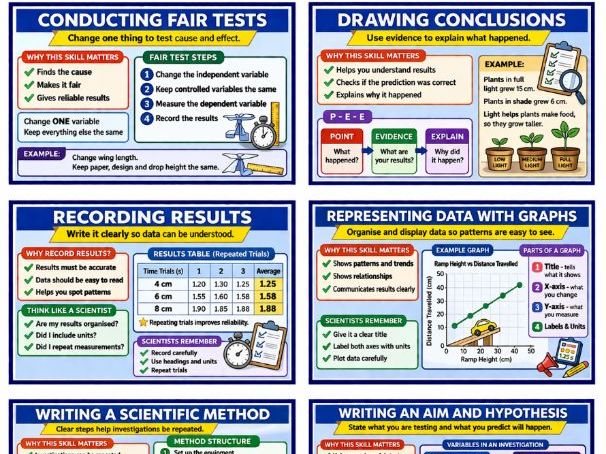


Develop students’ ability to present scientific data clearly and accurately.
Students will learn to:
Choose appropriate graph types
Label axes correctly
Scale graphs effectively
Interpret graphical trends
Ideal for:
Data analysis units
Assessment tasks
Cross-curricular numeracy
Included:
Printable PDF ( A2)
High-resolution PNG: Editable for your classroom
As part of the Investigate Like a Scientist program, these classroom posters are most powerful when used with the matching classroom slides and the experiment/investigation workbook. The posters and teaching slides provide the explicit instruction, while the workbook allows students to apply the skill sequence in a structured and professional format.
Get this resource as part of a bundle and save up to 27%
A bundle is a package of resources grouped together to teach a particular topic, or a series of lessons, in one place.
Something went wrong, please try again later.
This resource hasn't been reviewed yet
To ensure quality for our reviews, only customers who have purchased this resource can review it
Report this resourceto let us know if it violates our terms and conditions.
Our customer service team will review your report and will be in touch.
£2.50