
Science Fair: Bacteria Experiment for Science Fair or In Class:
Turn your students into real scientists with this long term experiment which teaches scientific literacy through the writing of a real scientific paper.
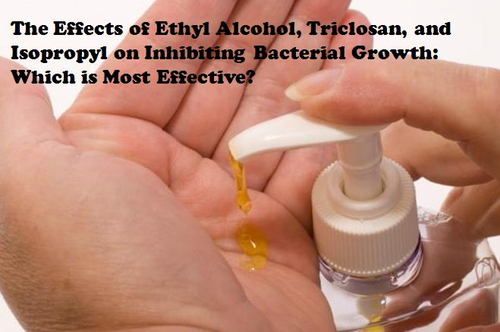
This product is an editable guided walk-through for the completion of a full scientific paper (Abstract, Introduction, Methods, Results, Discussion, Works Cited) based on the question: "Which antibacterial chemical: ethyl alcohol (hand sanitizer), isopropyl (rubbing alcohol), or Triclosan (Antibacterial soap) is the most effective at inhibiting bacterial growth?
This product contains:
1. A teachers guide: Descriptions on how to set-up the experiment, materials needed, procedures, and helpful tips.
2. A lesson on Analyzing a Scientific paper utilizing a graphic organizer (Scientific Paper Included)
3. Student pages: a guided walk-through taking the students through the process of writing a full scientific paper.
This long term project (which takes about 2-3 months to complete, spread out intermittently) guides students through the process of writing a scientific paper in the same way scientists write their scholarly papers. Students are taught how to write an Abstract, Introduction, Methods, Results, Discussion, and works cited section.
This guided walk-through covers the following topics:
Abstract:
* Explanations of what goes in an introduction
- What the study was about & the hypothesis
- Summary of how the study was done
- The results that were obtained
- Significance of the results including the hypothesis being supported or not supported
Introduction:
* Explanations of what goes in an introduction
- What bacteria colonies are and what they look like (color, size,shape texture, etc.)
- What Fungal colonies are and what they look like
- The Cellular processes by which ethyl alcohol, isopropyl, and triclosan work to kill bacteria
Methods:
* Teacher notes and tips for conducting the experiment
Results:
* Instructions for:
- Calculating the average number of bacterial colonies
- Graphing the data
- Interpreting the data graph in words
- Describing the appearance of bacterial and fungal colonies
Discussion:
* Instructions for:
- Calculating the data to see if they are statistically significant
- Interpreting the significance of the data
- Calculating Percent effectiveness
- Supporting or not supporting the hypothesis
- Creating a theory to explain the results
- Creating an additional experiment that could be done to test the theory
- Discussing issues that occurred during in the experiment
Something went wrong, please try again later.
This resource hasn't been reviewed yet
To ensure quality for our reviews, only customers who have purchased this resource can review it
Report this resourceto let us know if it violates our terms and conditions.
Our customer service team will review your report and will be in touch.
$7.50
