
**4 to 5 lessons **
Topic: Working scientifically / graphs / handling data / introduction to physics
Level: key stage 3, key stage 4
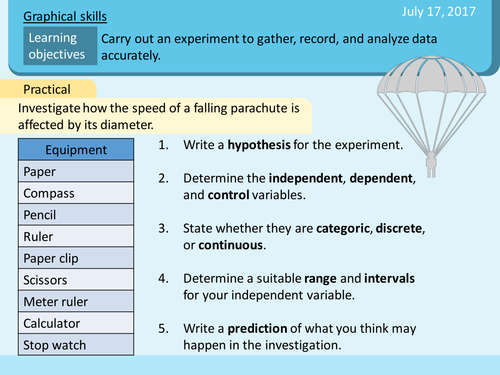
Here is a bundle of resources that I used as an introduction to science, particularly physics, for my year 9 class. They will learn the necessary skills to plot a graph and handle experimental data. A practical lesson is included.
They are great as “ice breaker” activities for new classes, as well. For example, there is a “little red riding hood” graph plotting activity in which I ask a student to tell the story of little red riding hood. The students then plot a graph of little red riding hood’s happiness throughout her journey. The instructions are deliberately arbitrary so that the class can compare and discuss the graphs that they have plotted afterwards, identifying their errors.
Resources:
1. Powerpoint slides: 3 sets of powerpoint slides, each compatible with a set of worksheets. Slides contain information and tasks for pupils. 1 set of powerpoint slides for a practical lesson.
2. Notes (editable documents) for pupils: Use 3 sets of documents as worksheets or handouts. Pupils can take notes during lesson or complete tasks in this editable document.
Hope this resource is helpful for you. Please do let me know if there’s any suggestions for improvement. I aim to upload more lessons following this topic.
Enjoy!
Something went wrong, please try again later.
This resource hasn't been reviewed yet
To ensure quality for our reviews, only customers who have purchased this resource can review it
Report this resourceto let us know if it violates our terms and conditions.
Our customer service team will review your report and will be in touch.
£5.00