
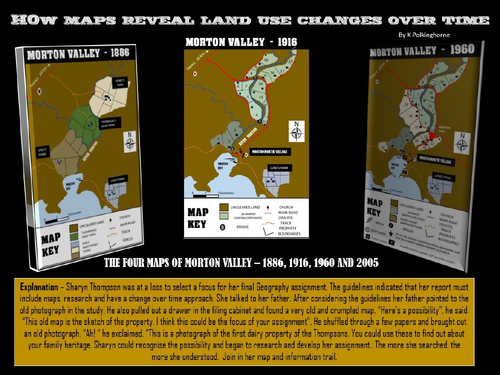
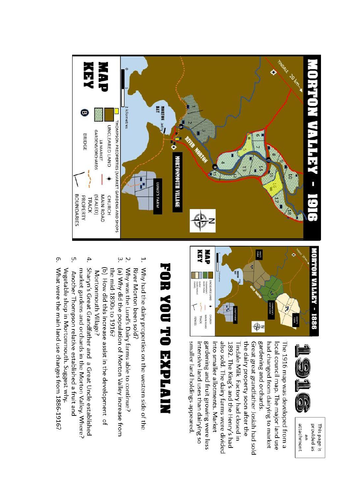
Maps record history. Single dated maps reveal a visual dated representation. A series of maps of the same area but with different dates reveal changes over time. This unit is a result of a final resources project carried out by Sharyn Thompson in her final year (Year 12) in Geography . It shows how senior Geography students were able to follow guidelines to develop a research paper. Some parts have been left open for your students to participate in the investigation of change via the attachment pages. You can use this title as a practical interpretation activity. It could be used for teachers to formulate their own project activity for their senior students in humanities (Geography/History/Urban changes). This study on the land use changes of Morton Valley indicates the place maps can have in recognising development over time.
Something went wrong, please try again later.
This resource hasn't been reviewed yet
To ensure quality for our reviews, only customers who have downloaded this resource can review it
Report this resourceto let us know if it violates our terms and conditions.
Our customer service team will review your report and will be in touch.
£0.00