
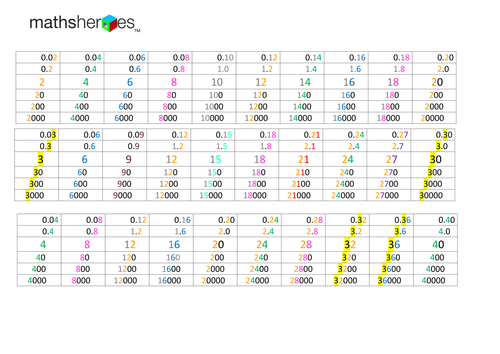
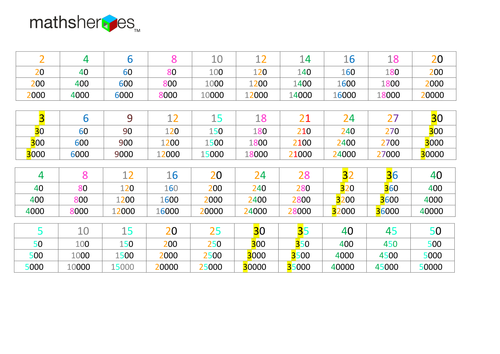

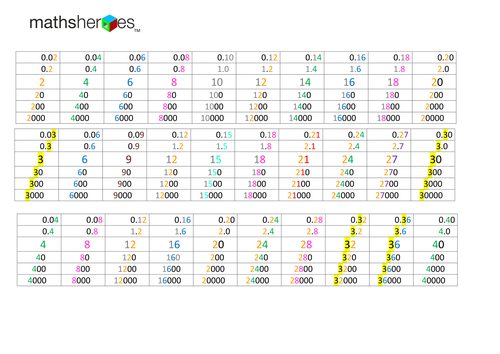
To enable students to see the relationship between 2, 4, 6, 8, 10, 20, 40, 60, 80, 100, 200, 400 etc I have set each one out in a table so that each row is a times table and each column is x10 the row above (take a look and you will see what I mean). The many patterns are highly visible and allow for great discussion or can be used as a support for whichever times tables you are practicing eg print out strip of 3s for each student to stick on their desk. The colours match a system I use where each digit has a specific colour - if you don't like it CRTL-A and change the font colour to black and turn off highlighting :) Any feedback is always appreciated. Thanks C
Something went wrong, please try again later.
thanks<br />
Report this resourceto let us know if it violates our terms and conditions.
Our customer service team will review your report and will be in touch.
£0.00