
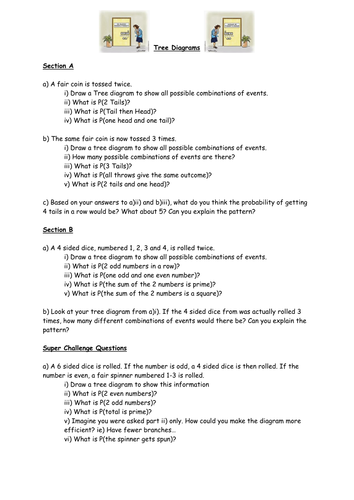
This lesson is intended as an introduction to Tree diagrams. In it, pupils see how Tree diagrams can be used to show different combinations of events, and can therefore be used to calculate probabilities. There are no probabilities on the diagrams at this point, this idea can be introduced at a later date. The worksheet has a variety of questions, with answers included. If you liked this resource then please check out my other stuff on TES - all free!
https://www.tes.com/teaching-resources/shop/Owen134866
https://www.tes.com/teaching-resources/shop/Owen134866
Something went wrong, please try again later.
Thank you for publishing your resource. It has been selected to be featured in <a href="https://www.tes.com/teaching-resources/collections/secondary-maths/"> a new secondary maths collection</a>.
Report this resourceto let us know if it violates our terms and conditions.
Our customer service team will review your report and will be in touch.
£0.00