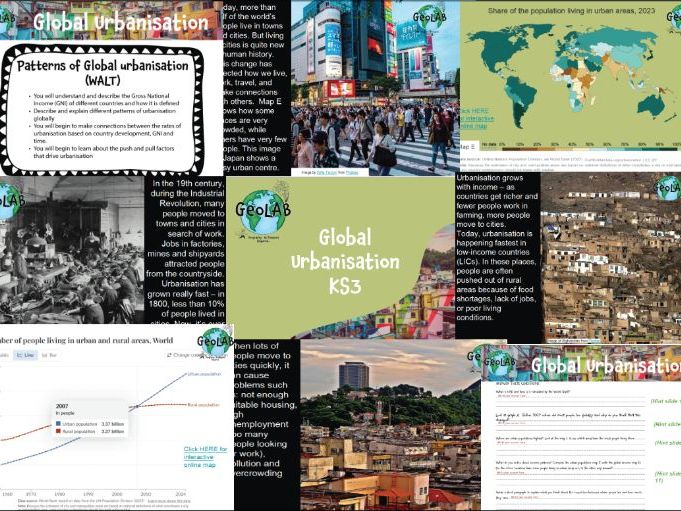

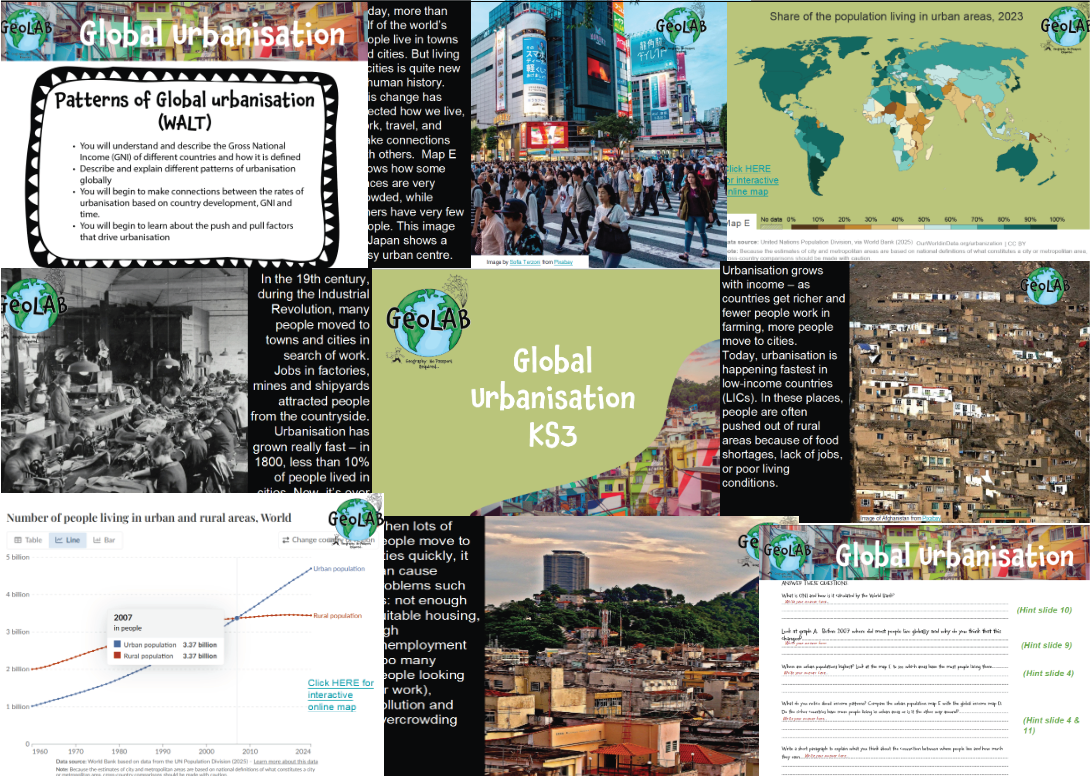
This activity explores the spatial distribution of urban population, the relationship with the income of a country (GNI), the changes of rural/urban populations over time. Slides include links to interactive world maps from the World Bank for GNI and also to the Our World in Data study - here students can conduct their own investigations understanding how different urban populations have changed over time. There is a printable paper worksheet and also an electronic student PowerPoint.
** What’s included:**
Learning objectives WALT (in slides)
Global urban population map (interactive) - Our World in Data
Rates of urbanisation and GNI
Rural & urban population changes globally (interactive map) Our World in Data
GNI country definitions (World Bank)
World by income & region (interactive map) World Bank
GNI activity
Urbanisation activity (data response based on urban population and GNI maps provided)
14 slides in total
Please feel free to leave a review as all feedback helps make better resources for you.
Something went wrong, please try again later.
I had downloaded another lesson in the series and wanted to try more. Excellent use of uptodate data and information from the world bank and graphs maps and statistics from our world in data. In addition to paper worksheets are the electronic slides for self paced work. The electronic workshhets are good as they provide external links to interactive maps. I would suggest making a file for things that could be printed (key maps) and then stuck into books e.g. 3 maps on a paper so they can be quickly run through the copier. But yeah...excellent value. Looking forward to more case studies.
Great resources for flipped learning and upload to google classroom and a wealth of resources for free.
Report this resourceto let us know if it violates our terms and conditions.
Our customer service team will review your report and will be in touch.
£0.00