


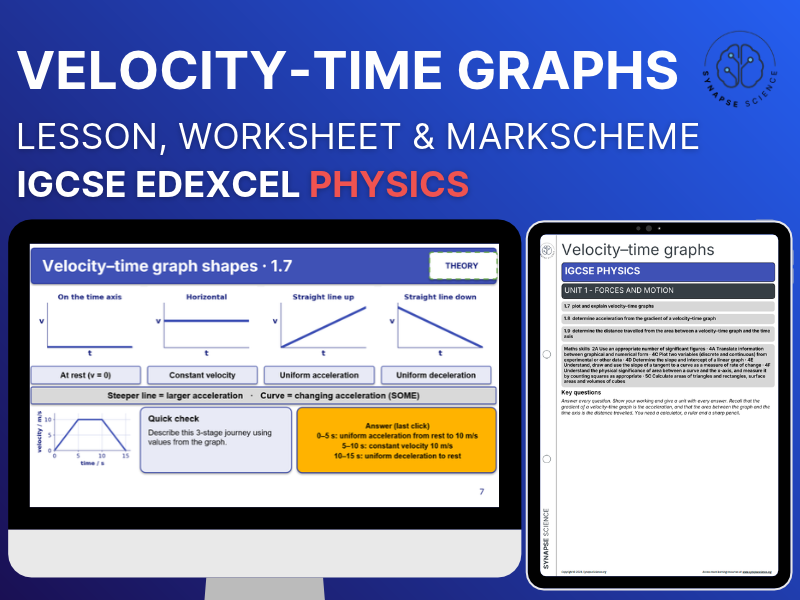
Velocity–Time Graphs – Lesson, Worksheet & Mark Scheme – Unit 1 – IGCSE Physics
Velocity–Time Graphs, Acceleration from the Gradient and Distance from the Area
This Synapse Science resource teaches students to plot and explain velocity–time graphs and describe the motion they show: constant velocity, acceleration, deceleration and stationary. It is part of the Synapse Science Unit 1: Forces and Motion pack.
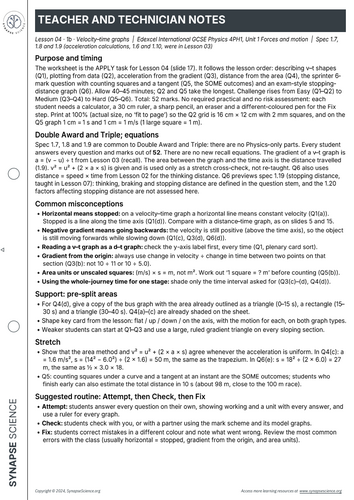
Students find acceleration from the gradient and distance travelled from the area under the graph, then apply both to multi-stage journeys and stopping distances.
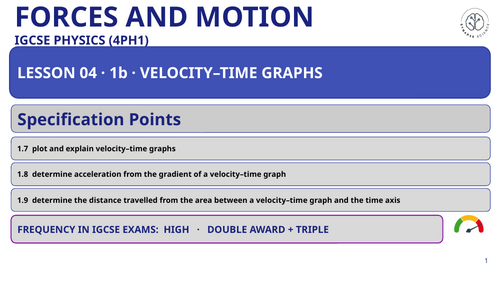
TOPICS COVERED – SPECIFICATION POINTS
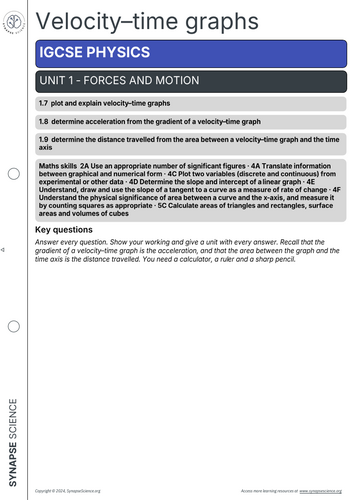
- 1.7: Plot and explain velocity–time graphs
- 1.8: Determine acceleration from the gradient of a velocity–time graph
- 1.9: Determine the distance travelled from the area between a velocity–time graph and the time axis
WHAT’S INCLUDED
- Editable PowerPoint lesson with worked examples, graded practice, exit ticket and video review
- Printable differentiated worksheet (6 questions, 52 marks, with a 1–9 grade guide)
- Teacher notes and a full mark scheme in Edexcel exam style
KEY FEATURES
- Gradient and area methods practised step by step, including trapezium areas
- Clear comparison with distance–time graphs to avoid mixing them up
- Exam-style stopping distance question that previews thinking and braking distance
- Consistent Synapse Science format for seamless delivery
PAIRS WELL WITH
Something went wrong, please try again later.
This resource hasn't been reviewed yet
To ensure quality for our reviews, only customers who have purchased this resource can review it
Report this resourceto let us know if it violates our terms and conditions.
Our customer service team will review your report and will be in touch.
£3.00