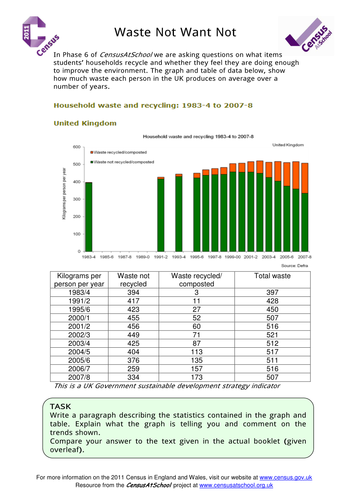

Students are asked to explain and summarise facts given in a graph and data table showing UK household waste and recycling figures from 1983 to 2004. Linked to the CensusAtSchool Phase 6 questions on the environment.
We now have an updated version of this resource, we have left the previous one here for comparison. (Interpreting charts and graphs, pie charts and bar charts for KS3.)
Something went wrong, please try again later.
This resource hasn't been reviewed yet
To ensure quality for our reviews, only customers who have downloaded this resource can review it
Report this resourceto let us know if it violates our terms and conditions.
Our customer service team will review your report and will be in touch.
£0.00