
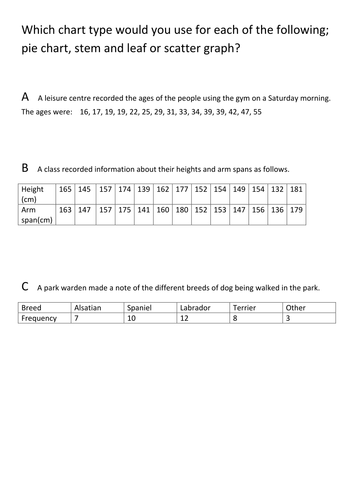
This resource has 3 sets of data. Students have to decide which graph would be most suitable; pie chart, stem and leaf or scatter graph? They should also explain why this is the best choice in each case.
This is a good resource for differentiation because having chosen the graph type students can then draw the graphs. Students can be directed to draw either a single one, two of them or all three depending on their ability and the time you want to give them.
I have used this exercise as a starter as well as in revision.
Something went wrong, please try again later.
This resource hasn't been reviewed yet
To ensure quality for our reviews, only customers who have downloaded this resource can review it
Report this resourceto let us know if it violates our terms and conditions.
Our customer service team will review your report and will be in touch.
£0.00