
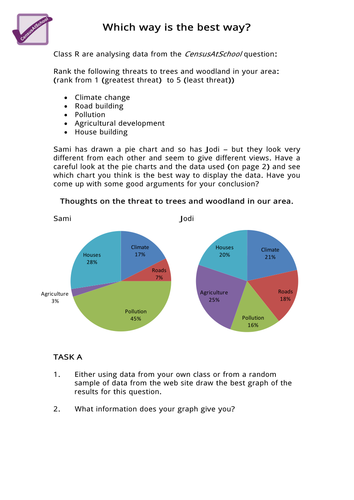
What is the best way to construct a graph from data that is ranked? This worksheet looks at Q13 of Phase 3 and explores how to graph the data using pie charts and stacked bar charts. (Interpreting charts and graphs, pie charts and presenting data for KS3.)
Something went wrong, please try again later.
This resource hasn't been reviewed yet
To ensure quality for our reviews, only customers who have downloaded this resource can review it
Report this resourceto let us know if it violates our terms and conditions.
Our customer service team will review your report and will be in touch.
£0.00