


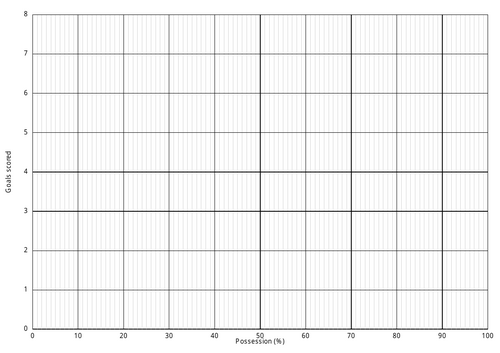
An investigation using the handling data cycle into the correlation between possession and goals scored in the group stages of World Cup 2026.
Two or three lessons (inc. creating some nice display work) on how to do a handling data investigation - forming a hypothesis, collecting the data, representing the data, (plus a bonus element of finding averages - mean from a frequency table), and then interpreting the data. Is there correlation?
Potentially to be done after a lesson on scatter graphs.
Something went wrong, please try again later.
This resource hasn't been reviewed yet
To ensure quality for our reviews, only customers who have downloaded this resource can review it
Report this resourceto let us know if it violates our terms and conditions.
Our customer service team will review your report and will be in touch.
£0.00