Carefully Animated lesson on how to enlarge and describe shapes according to given scale factor and centre of enlargement.
Excellent animation to bring life in delivering maths concepts, accessible to all. This presentation will boost your confidence and enthusiasm in maths.
Very useful for audio visual learners.
Carefully Animated lesson on how to translate and describe translation using column vectors.
Excellent animation to bring life in delivering maths concepts, accessible to all. This presentation will boost your confidence and enthusiasm in maths.
Very useful for audio visual learners.
Carefully animated lesson on how to reflect and describe reflection of shapes.
Excellent animation to bring life in delivering maths concepts, accessible to all. This presentation will boost your confidence and enthusiasm in maths.
Very useful for audio visual learners.
Carefully Animated lesson on how to use scale representation and bearings to show relative positions of points.
Excellent animation, bringing life in delivering maths concepts, accessible to all.
This lesson will boost the confidence and enthusiasm of students in maths.
Useful for visual learners.
Carefully Animated lesson on how to measure and calculate bearings to show relative positions of points.
Excellent animation, bringing life in delivering maths concepts, accessible to all.
This lesson will boost the confidence and enthusiasm of students in maths.
Carefully Animated lesson on how to draw various graphs.
Excellent animation to bring life in delivering maths concepts, accessible to all. This presentation will boost your confidence and enthusiasm in maths.
Complete lesson Velocity Time Graph.
Excellent animation to bring life in delivering maths concepts, accessible to all. This presentation will boost your confidence and enthusiasm in maths.
Carefully Animated lesson on how to draw Exponential Graphs.
It also covers calculations involving exponential functions.
Excellent animation to bring life in delivering maths concepts, accessible to all. This presentation will boost your confidence and enthusiasm in maths.
Carefully Animated lesson on how to draw Reciprocal Graphs
Excellent animation to bring life in delivering maths concepts, accessible to all. This presentation will boost your confidence and enthusiasm in maths.
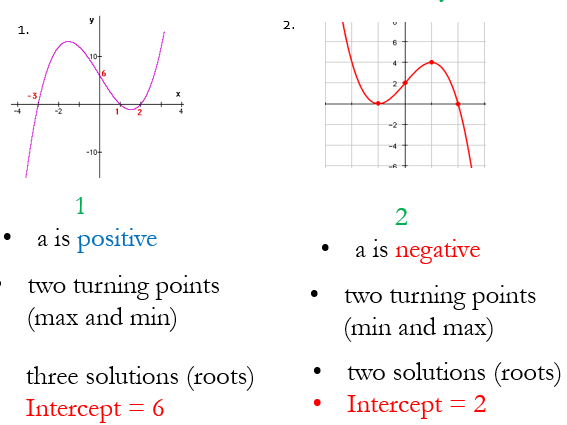
Carefully Animated lesson on how to draw and sketch cubic graphs.
Excellent animation to bring life in delivering maths concepts, accessible to all. This presentation will boost your confidence and enthusiasm in maths.
Carefully Animated lesson on how to draw quadratic graphs.
This presentation show both the calculator and non calculator method.
Excellent animation to bring life in delivering maths concepts, accessible to all. This presentation will boost your confidence and enthusiasm in maths.
This presentation is to introduce to you a new and unique way to solve quadratic equation using Difference of Two Squares.
The presentation is carefully animated using colour coordination to arouse the interest of Visual Learners.
This method is very useful for solving complex quadratic equations without using calculator, thereby giving answers in surd form where appropriate.
Carefully animated lesson on
how to draw Cumulative Frequency Curve
how to draw box plot from Cumulative Frequency Curve
how to compare Cumulative Frequency Curves
This presentation is very useful for visual learners.
Carefully animated lesson on
how to draw box plot from raw data
how to compare box plot and make valid conclusions
This presentation is very useful for visual learners.
In this presentation, you will be able to:
-know the formula for calculating volume of spheres and hemisphere
-extend their knowledge to calculate volume of composite solids
solve exam style questions
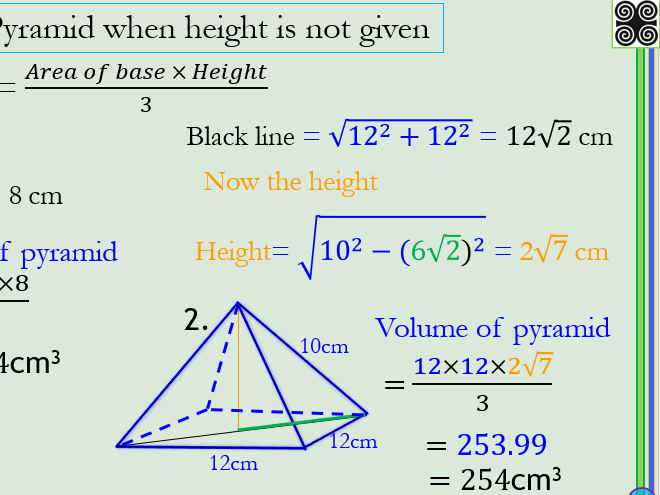
In this presentation, you will be able to:
-know the formula for calculating volume of pyramids and cones
-extend their knowledge to calculate volume of frustum
-solve exam style questions
In this presentation, you will be able to:
-understand the derivation of volume of cuboid formula
-calculate missing length of a cuboid given the volume and two dimensions
-convert volume measure from one unit to the other
-understand that volume can also be attributed to amount of liquid/capacity of a container or bottle
-solve exam style questions