Statistics

In these chapters, the study of data comes to life as pupils become aware of its prevalence in their everyday existence.

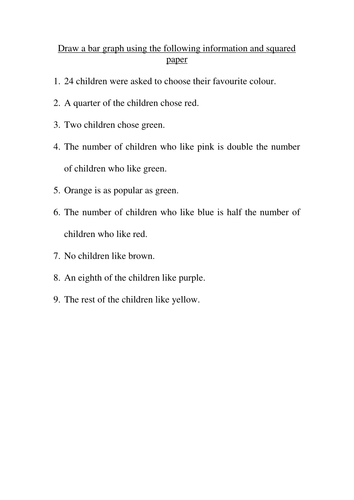
To begin with, pupils will learn that data can be presented in the form of a list of numbers or objects, or as a table, chart or graph. They will look at how different types of data can be recorded before using and analysing these representations to solve increasingly difficult problems. In addition, they will also find simple summary statistics, including the mean average. 

Pupils will work with given data sets, as well as those they have collected. In order to encourage them to appreciate that data and statistics are all around them (and not just in mathematics), examples should be set in familiar contexts. As such, pupils may look in magazines and brochures, as well as on the internet, to find real-life statistical use.

The study of statistics offers an opportunity to reinforce pupils’ understanding of number, place value and the four operations in the solving of problems. More specifically, graphs, charts and tables may offer useful links to time, fractions, ratio and proportion. It is important that such connections are made explicit, and that pupils have a chance to use statistics in other topic areas as well.

Teaching statistics

Get your KS1 and KS2 classes stuck into statistics, one of the most practical and important mathematical topics.

Chapter 1: Introduction to graphs

In this chapter, pupils start to work with simple tables and graphs, both in and outside of the classroom.

Pupils start by constructing and interpreting simple pictograms, tally charts, block diagrams and tables. They ask questions and answer problems related to these graphs and in doing so, reinforce their work on place value and the four rules.

When it comes to pictograms, pupils understand that a simple picture is used to represent data. They may interpret them by counting in 2s, 5s and 10s, depending on their progress in other topics. They also use their ability to count in 5s to help them to find totals for categories in simple tally charts.

More widely, pupils answer simple questions by counting the number of objects in specific categories, which they can sort by quantity. For example, given a tally chart detailing the favourite ice-cream flavours of a group of children, they work out which flavour is the most liked.

Pupils should construct and interpret graphs and charts using real-life examples related to their own experiences, and make the most of using them in other areas of the curriculum.

Chapter 2: Using graphs

In this chapter, pupils interpret and present data using bar charts, pictograms and tables.

Building on learning from the previous chapter, pupils extend their knowledge of graphs by working with basic bar charts and solving one- and two-step questions, such as “How many more…?” and “How many fewer…?”. They go on to ask questions and answer problems related to these graphs, which continues to reinforce work on place value and the four rules. The size of the numbers used should be appropriate to their understanding of place value.

Pupils become increasingly confident in solving problems involving scaled bar charts, pictograms and tables. They read off values from scales in bar charts to work out data for different categories with increasing accuracy. They also continue to interpret pictograms that require them to count in 2s, 5s and 10s. Pictograms are additionally used to reinforce the relationship between a fraction of a shape and a fraction of a quantity.

Once again, pupils should construct and interpret graphs and charts using real-life examples related to their own experiences. As well as being given graphs to work with, pupils should also have the opportunity to collect and organise their own data. Ideally, this would occur in a cross-curricular capacity.

Chapter 3: Bar charts, pictograms, time graphs and tables

In this chapter, pupils are introduced to the concept of continuous data and draw time graphs.

Pupils continue to construct and interpret bar charts, pictograms and tables and solve comparison, sum and difference problems using information presented in them. They start to realise that bar charts and pictograms are often used to present discrete data, although this term may not be used.

Now, pupils start to explore examples of continuous data, including the ways it can be collected and presented. In addition, they represent data over time in the form of a time graph, and use these graphs to retrieve information and solve simple problems.

As in previous chapters, this work should be linked to other areas of the curriculum. Take science, for example. Pupils may plant a seed, measure the height of a plant each day for a month and record this data in a table. They may then represent this in the form of a time graph, from which they can compare results with other pupils. The discussion that may arise as a result is an excellent example of the rich learning that can occur as a result of making cross-curricular links.

Chapter 4: Line graphs and tables

In this chapter, pupils read and interpret data in tables and solve problems using information from line graphs.

Pupils extend their introduction to line graphs by using them to solve comparison, sum and difference problems. They make connections between their previous work on co-ordinates and scales with that on time graphs.

As they are introduced to a wider variety of representations, pupils are able to choose the most appropriate graph or chart for a given set of data, as well as give reasons for their choice.

Additionally, they work with a wider range of tables and charts, including timetables. They may, for example, plan a journey using a bus or a train, or look at the high tide times at the seaside. This naturally links to previous work on time.

Chapter 5: Pie charts, line graphs and the mean average

In this chapter, pupils draw and interpret pie charts and calculate the mean average of a set of numbers.

Pupils continue to interpret and construct line graphs and use them to solve increasingly difficult problems. While most of the graphs and charts that pupils have encountered so far have looked fairly similar, pupils now move on to interpret and construct pie charts, which look significantly different.

To begin with, pupils understand that a pie chart is circular and that the size of each slice is relevant to the size of the category. They must be secure in their understanding of these concepts before moving on to tackle related questions. It may help to make explicit links to previous work on angles, fractions and proportion at this point.

Pupils also calculate and interpret the mean as an average. This is the first average that pupils will have met and so it is important that care is taken with its introduction, which ought to focus on meaning. Pupils start to explore data sets where the mean is an appropriate calculation for the average, as well as others where it is less so.

Statistics: Teaching for mastery booklet

Brought to you by Tes in partnership with experts at Mathematics Mastery and the White Rose Maths Hub, this PDF provides teachers with the progression of learning for the topic, broken down into digestible chapters.

It is an ideal starting point for primary teachers looking to brush up on their subject knowledge, or adopt the mastery approach to maths in their classroom.

Check out the Teaching for mastery site, which contains schemes of work accompanied by quality-assured classroom resources.

Download resources to match this topic in the planning and lesson resources pages of the new primary maths section.

By TES Resource Team

Teacher's guide: Teaching for mastery booklet

Brought to you by Tes in partnership with experts at Mathematics Mastery and the White Rose Maths Hub, this PDF provides teachers with the progression of learning for the topic, broken down into digestible chapters.

It is an ideal starting point for primary teachers looking to brush up on their subject knowledge, or adopt the mastery approach to maths in their classroom.

Check out the Teaching for mastery site, which contains schemes of work accompanied by quality-assured classroom resources.

Download resources for all primary maths topics in the planning and lesson resources pages of the new primary maths section.

By TES Resource Team

Approved resources

Related resources

Bar charts problem solving

The children first have to work out the information that needs to be entered into the bar graph by reading the statements about favourite colours. They then need to draw a bar graph showing the favourite colours.
By groov_e_chik