


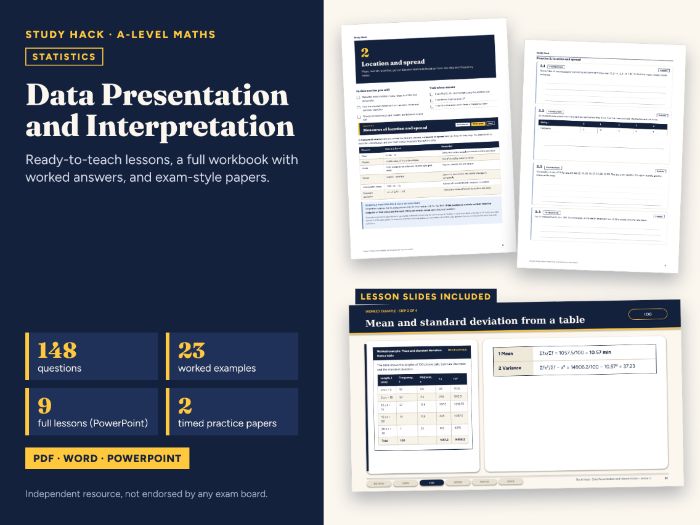
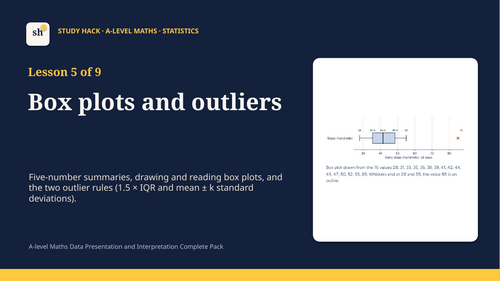
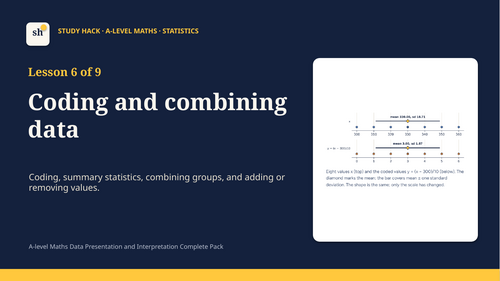
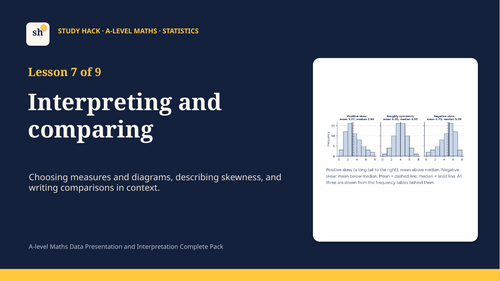
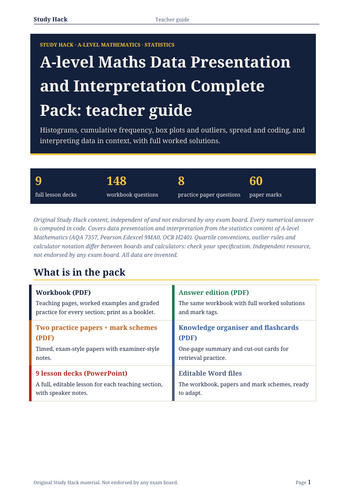

A-level Maths Data Presentation Complete Pack: 148 questions, 23 worked examples, 2 practice papers and 9 full PowerPoint lessons.
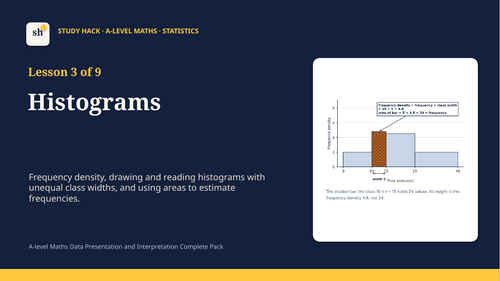
A statistics topic pack on data presentation and interpretation for A-level Mathematics, for teachers who want ready-to-teach lessons with matching practice, students revising on their own, and tutors who need a structured course. It covers histograms with unequal class widths, cumulative frequency, box plots, outliers, spread and coding.
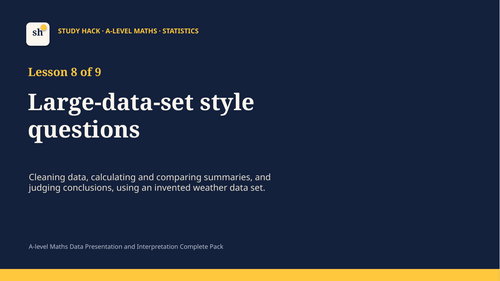
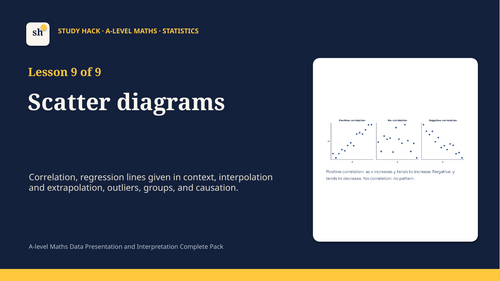
What is in the pack9 complete lessons (PowerPoint, 29 to 37 slides each): retrieval starter, objectives, key ideas, worked examples revealed step by step, mini-whiteboard questions with answers, independent and exam-style practice, an exit ticket and speaker notes on every slide.
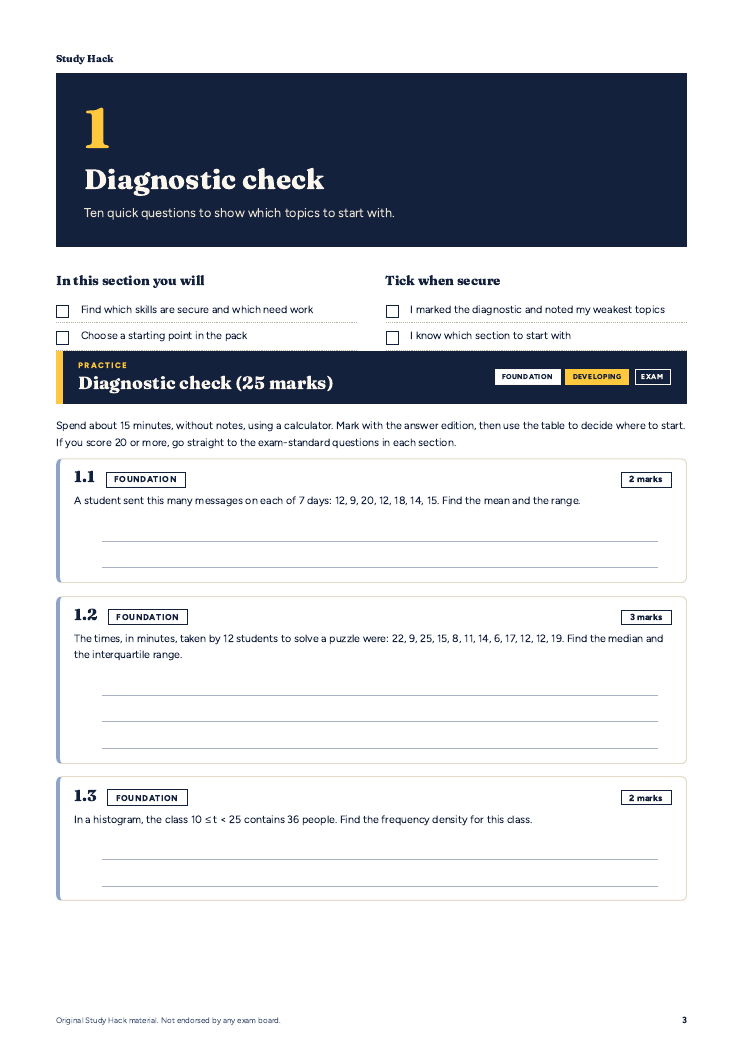
Workbook (89 pages): knowledge pages, 148 questions graded Foundation, Developing and Exam standard, 23 fully worked examples, a diagnostic, a mistake clinic and retrieval quizzes.
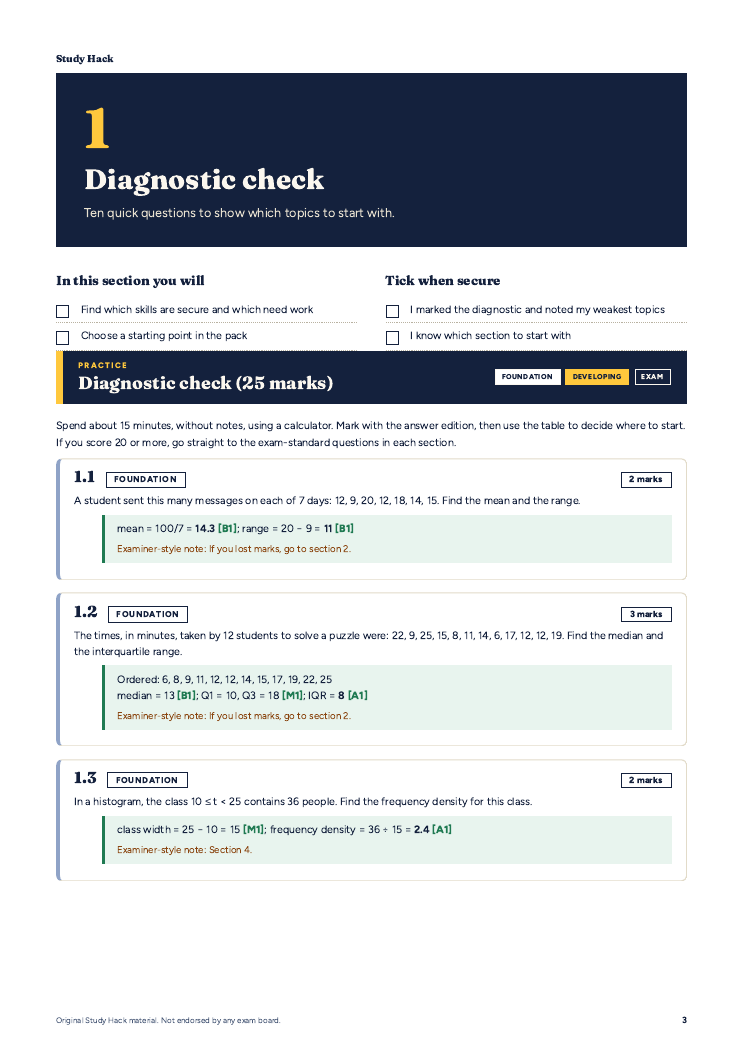
Answer edition (80 pages): full worked solutions with mark tags, so students can mark their own work.
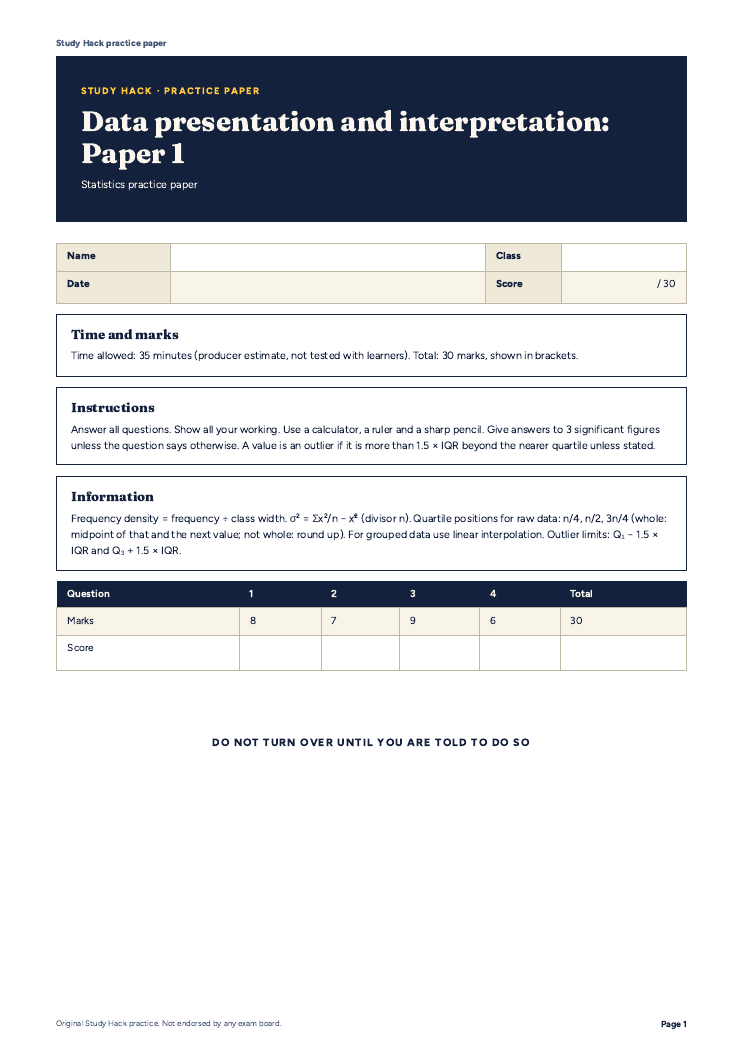
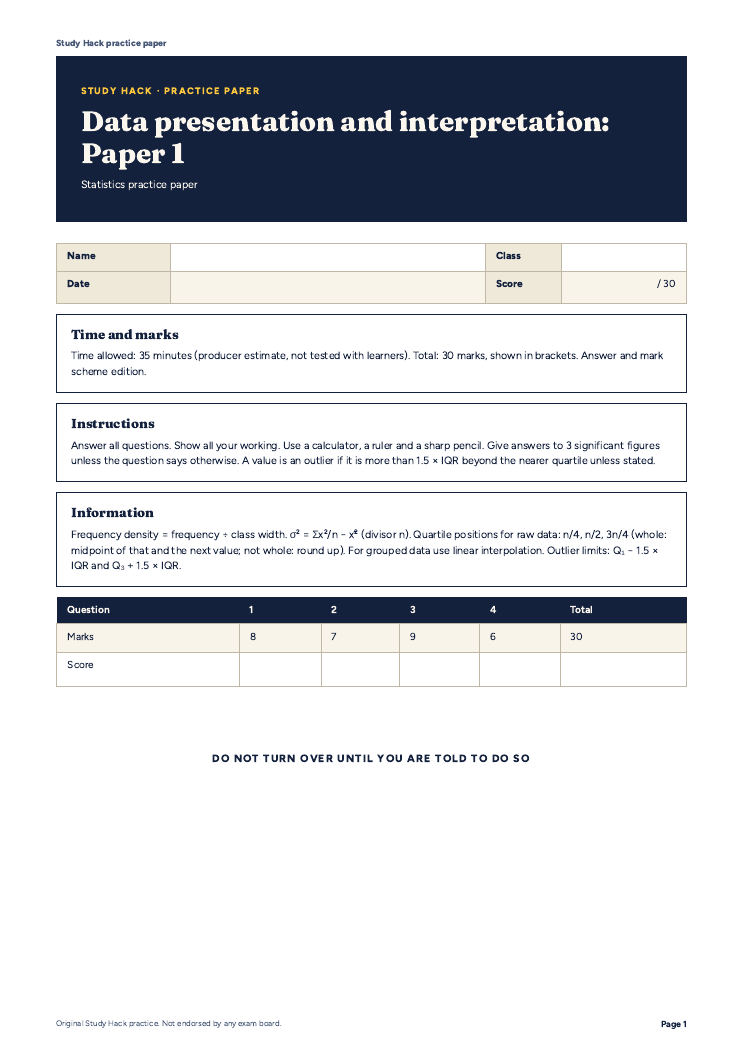
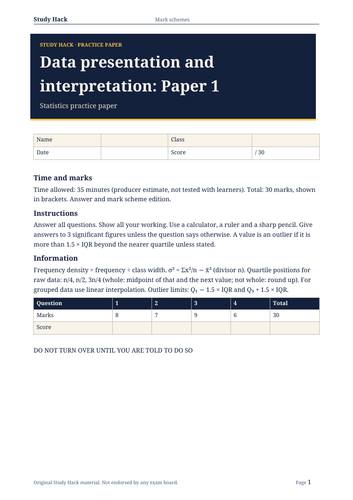
Two timed practice papers (30 marks each) with a separate mark scheme for each.
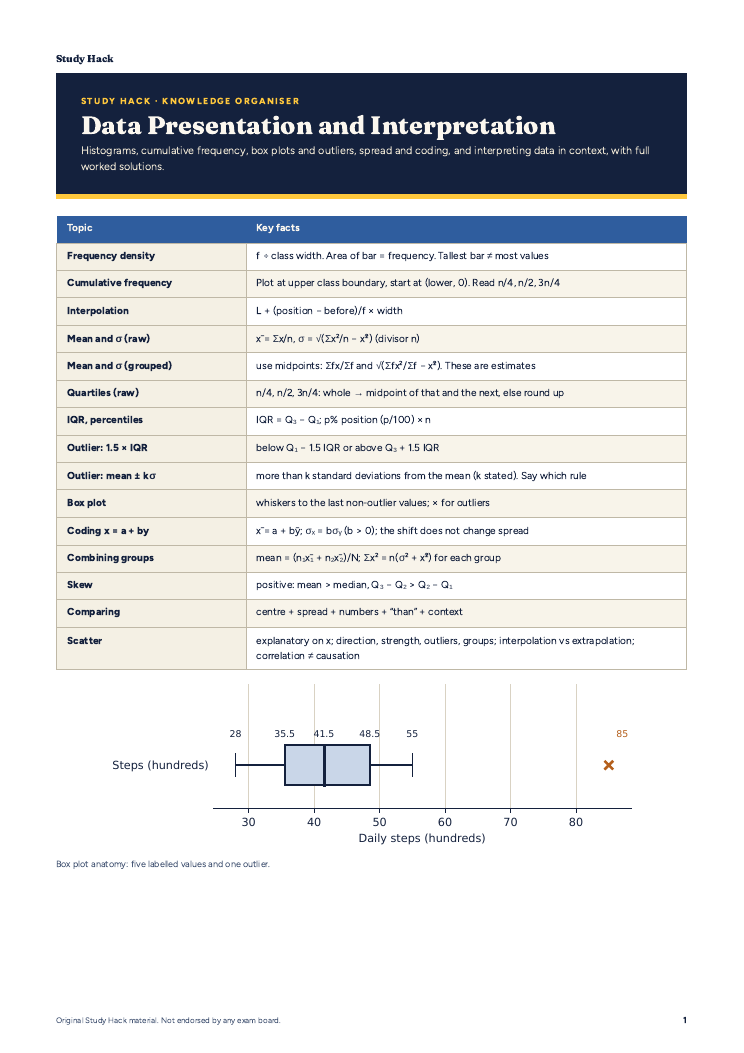
Also included: a knowledge organiser with key diagrams, double-sided flashcards, an illustrated teacher guide with a lesson-by-lesson plan, and editable Word versions of the workbook, papers and mark schemes.
The workbook and papers include 47 exact diagrams, each drawn to match its question. All data sets in the pack are invented.
Topics coveredLocation and spread; Grouped data; Histograms; Cumulative frequency; Box plots and outliers; Coding and combining data; Interpreting and comparing; Large-data-set style questions; Scatter diagrams.
How to use itTeach each topic with its lesson deck, set the matching workbook section as practice, and use the answer edition for self-marking. The diagnostic shows where to start, and the two timed papers work well before an assessment. The Word and PowerPoint files are fully editable.
Please noteCovers data presentation and interpretation from the statistics content of A-level Mathematics. Quartile conventions, outlier rules and calculator notation differ between boards and calculators: check your specification. Independent resource, not endorsed by any exam board. All data are invented.
Mark schemes use Study Hack’s own mark tags (M1, A1, B1) and are not an exam board mark scheme. This is an independent resource, not endorsed by any exam board; check it against the specification you teach. All questions are original Study Hack material.
Something went wrong, please try again later.
This resource hasn't been reviewed yet
To ensure quality for our reviews, only customers who have purchased this resource can review it
Report this resourceto let us know if it violates our terms and conditions.
Our customer service team will review your report and will be in touch.
£1.99