
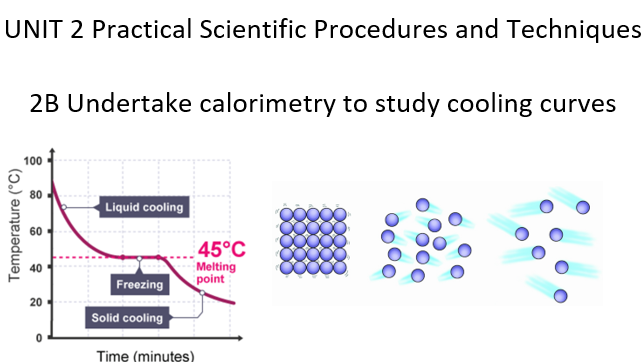
Learning Aim: B - Undertake calorimetry to study cooling curves
With this complete resource there is no need for any further preparation, all you need is here. Although there is a SAM example on the Pearson website, paid resources through Active Learn, the authorised assignment brief and the textbook I felt that a resource was required to make the delivery of this assignment clearer to the learners. I created this resource last year and have successfully used it with my groups. Learners build up the skill they require and practice with secondary data, so they are clear how to conduct the assessment.
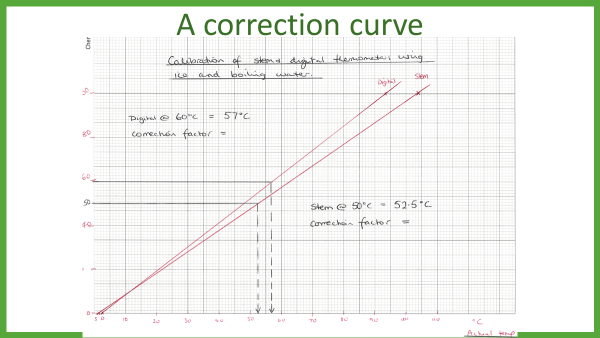
A workbook (22 pages) for learners to work through and a PowerPoint (44 slides) to guide the learners through the workbook. The workbook shows how to calibrate a thermometer, draw a graph, work out the correction factor, draw a cooling curve for stearic acid and paraffin wax, calculate the rate of cooling and describe the change of state, understand the errors within the experiment, calculate percentage error with the melting points and compare their data to the class data, as well as evaluation of the results and method.
Something went wrong, please try again later.
This resource hasn't been reviewed yet
To ensure quality for our reviews, only customers who have purchased this resource can review it
Report this resourceto let us know if it violates our terms and conditions.
Our customer service team will review your report and will be in touch.
£20.00